

| << Chapter < Page | Chapter >> Page > |
This circuit was designed as part of the demo that will be described in detail in chapter .
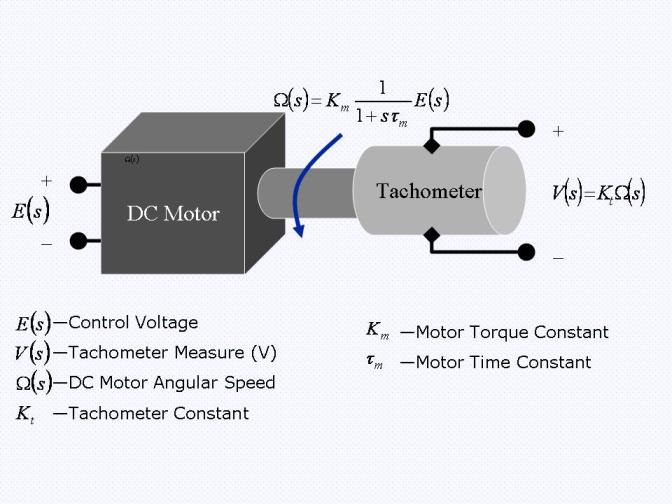
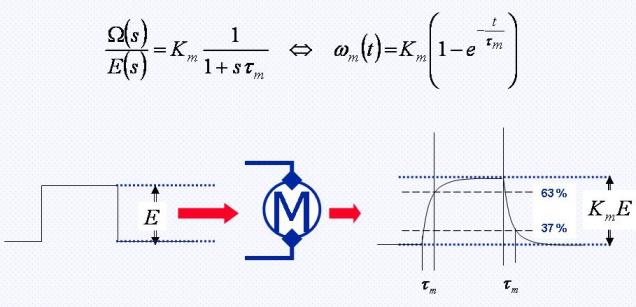
The transfer function of a DC motor can be approximated by a first order model with unknown constants. These constants can be identified experimentally.
The tachometer provides the feedback signal for speed control systems. A schematic diagram of the tachometer is given in Figure 6.
In this section we will identify the constants in the mathematical models of a DC motor and the tachometer experimentally. The process consists of consists of two parts:
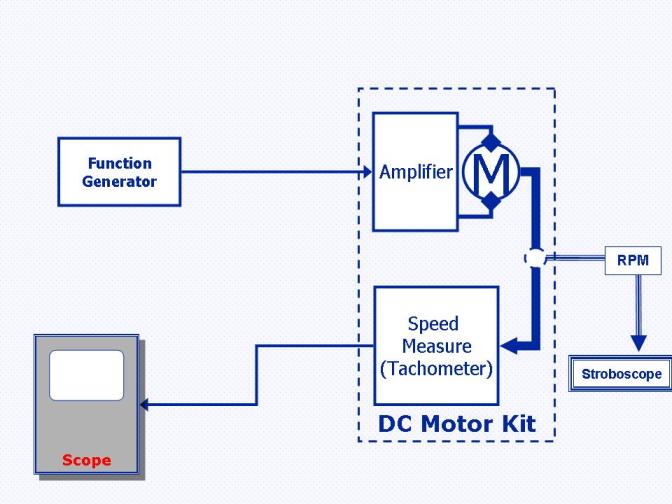
The tachometer coefficient and motor constant can be measured by generating a control voltage, using the PWM block of the DSP, and measuring:
The setup is shown in Figure 7.
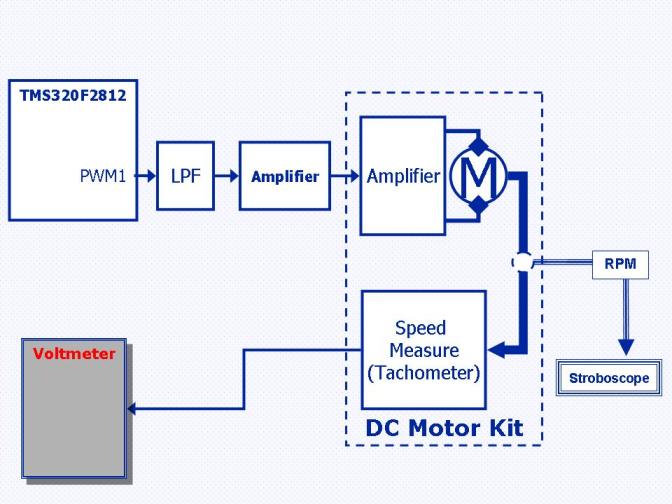
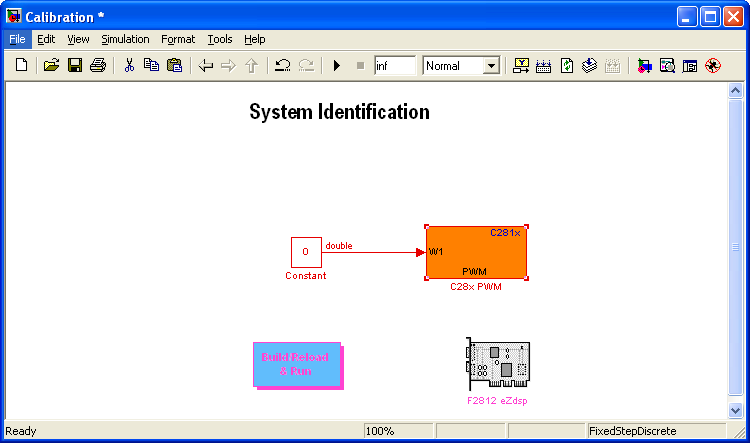
Figure 8 shows the model that will be used to generate the control voltage.
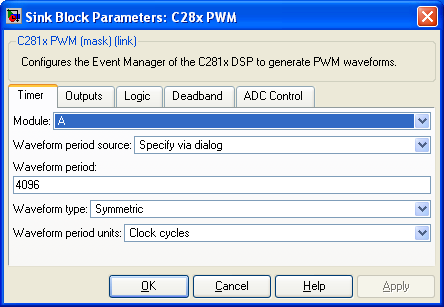
The PWM block will be configured to generate a PWM signal with a period of 4096 clock cycles of 75 MHz (please refer to Figure 9).
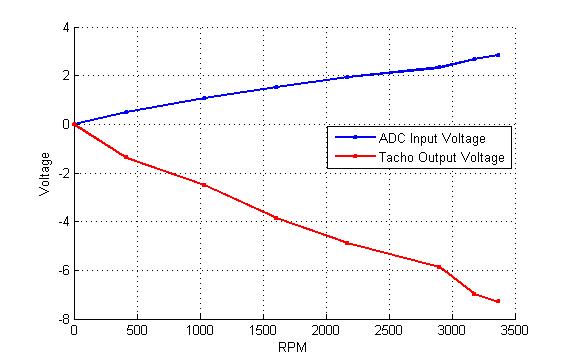
The ADC input voltage of the DSP should be in the range 0-3V, the therefore the tachometer output voltage must be inverted and scaled down. This is done with the circuit shown in Figure 19. The gain of this circuit is G = - 100/270 = - 0.37, i.e., inverting and attenuating approximately 1/3. The results obtained are shown in Figure 10.
The measurement of the time constant will be obtained by generating a square pulse and measuring the motor response to this stimulus. The principle of operation is shown in Figure 11; the experimental setup is shown in Figure 12.
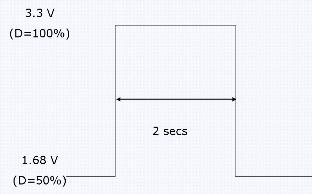
The Function Generator generates pulses, as shown in Figure 13.
The DC motor was modeled as a first-order linear system where ; however, the actual motor is not linear (due to friction, for example), therefore the measured values were:
Notification Switch
Would you like to follow the 'From matlab and simulink to real-time with ti dsp's' conversation and receive update notifications?

|
|

|
|

|
|

|
|

|
|
|
|
|

|
|

|
|

|
|
|
|