<< Chapter < Page Chapter >> Page >

Social sciences: geography

Grade 7

Natural hazards

Module 4

Earthquakes

1. The occurrence and cause of earthquakes

A scientist who had experienced a powerful earthquake told of how it seemed to him as if the whole world had become a carpet that was given a good shake and was laid down again. People, buildings, mountains – everyone and everything seemed to have become mere dust on the carpet.

[From: Die Huisgenoot - Jongspan , 21 May 1987]

You need to remember that the earth’s crust consists of large, flat plates of rock. They are kilometres thick and drift on the dense, warm mass of magma of the mantle. The movement is very slow, so it cannot be perceived. The layers of rock that are closer to the mantle are hotter and melt more readily. Nearer the surface of the earth, the layers of rock are cooler and therefore harder.

Where the plates of the earth meet, they collide or slide against one another. Because of the shifting of the layered rock, they may bend or fold and even break like a plank that is broken in two. The earth’s crust is able to withstand the stress and pressure that is built up because of the movement from within. When it reaches a point at which it cannot accommodate the pressure by bending or folding, it cracks and breaks. Then there is a shift in the layers of rock and people perceive it as an earthquake.A fault line occurs which is even visible at the earth’s surface.

An earthquake is felt for a few minutes only, but after-shocks may occur for a while afterwards.

The well-known San Andreas fault runs through San Francisco in the American state of California. Millions of people live in this area, and are aware of this threat.

Figure 5 shows how the large rock plates move past one another very slowly (5 – 7 cm per year). When the sides hook onto one another, the stress increases. The rocks suddenly move and start to break off. The result – an earthquake occurs.
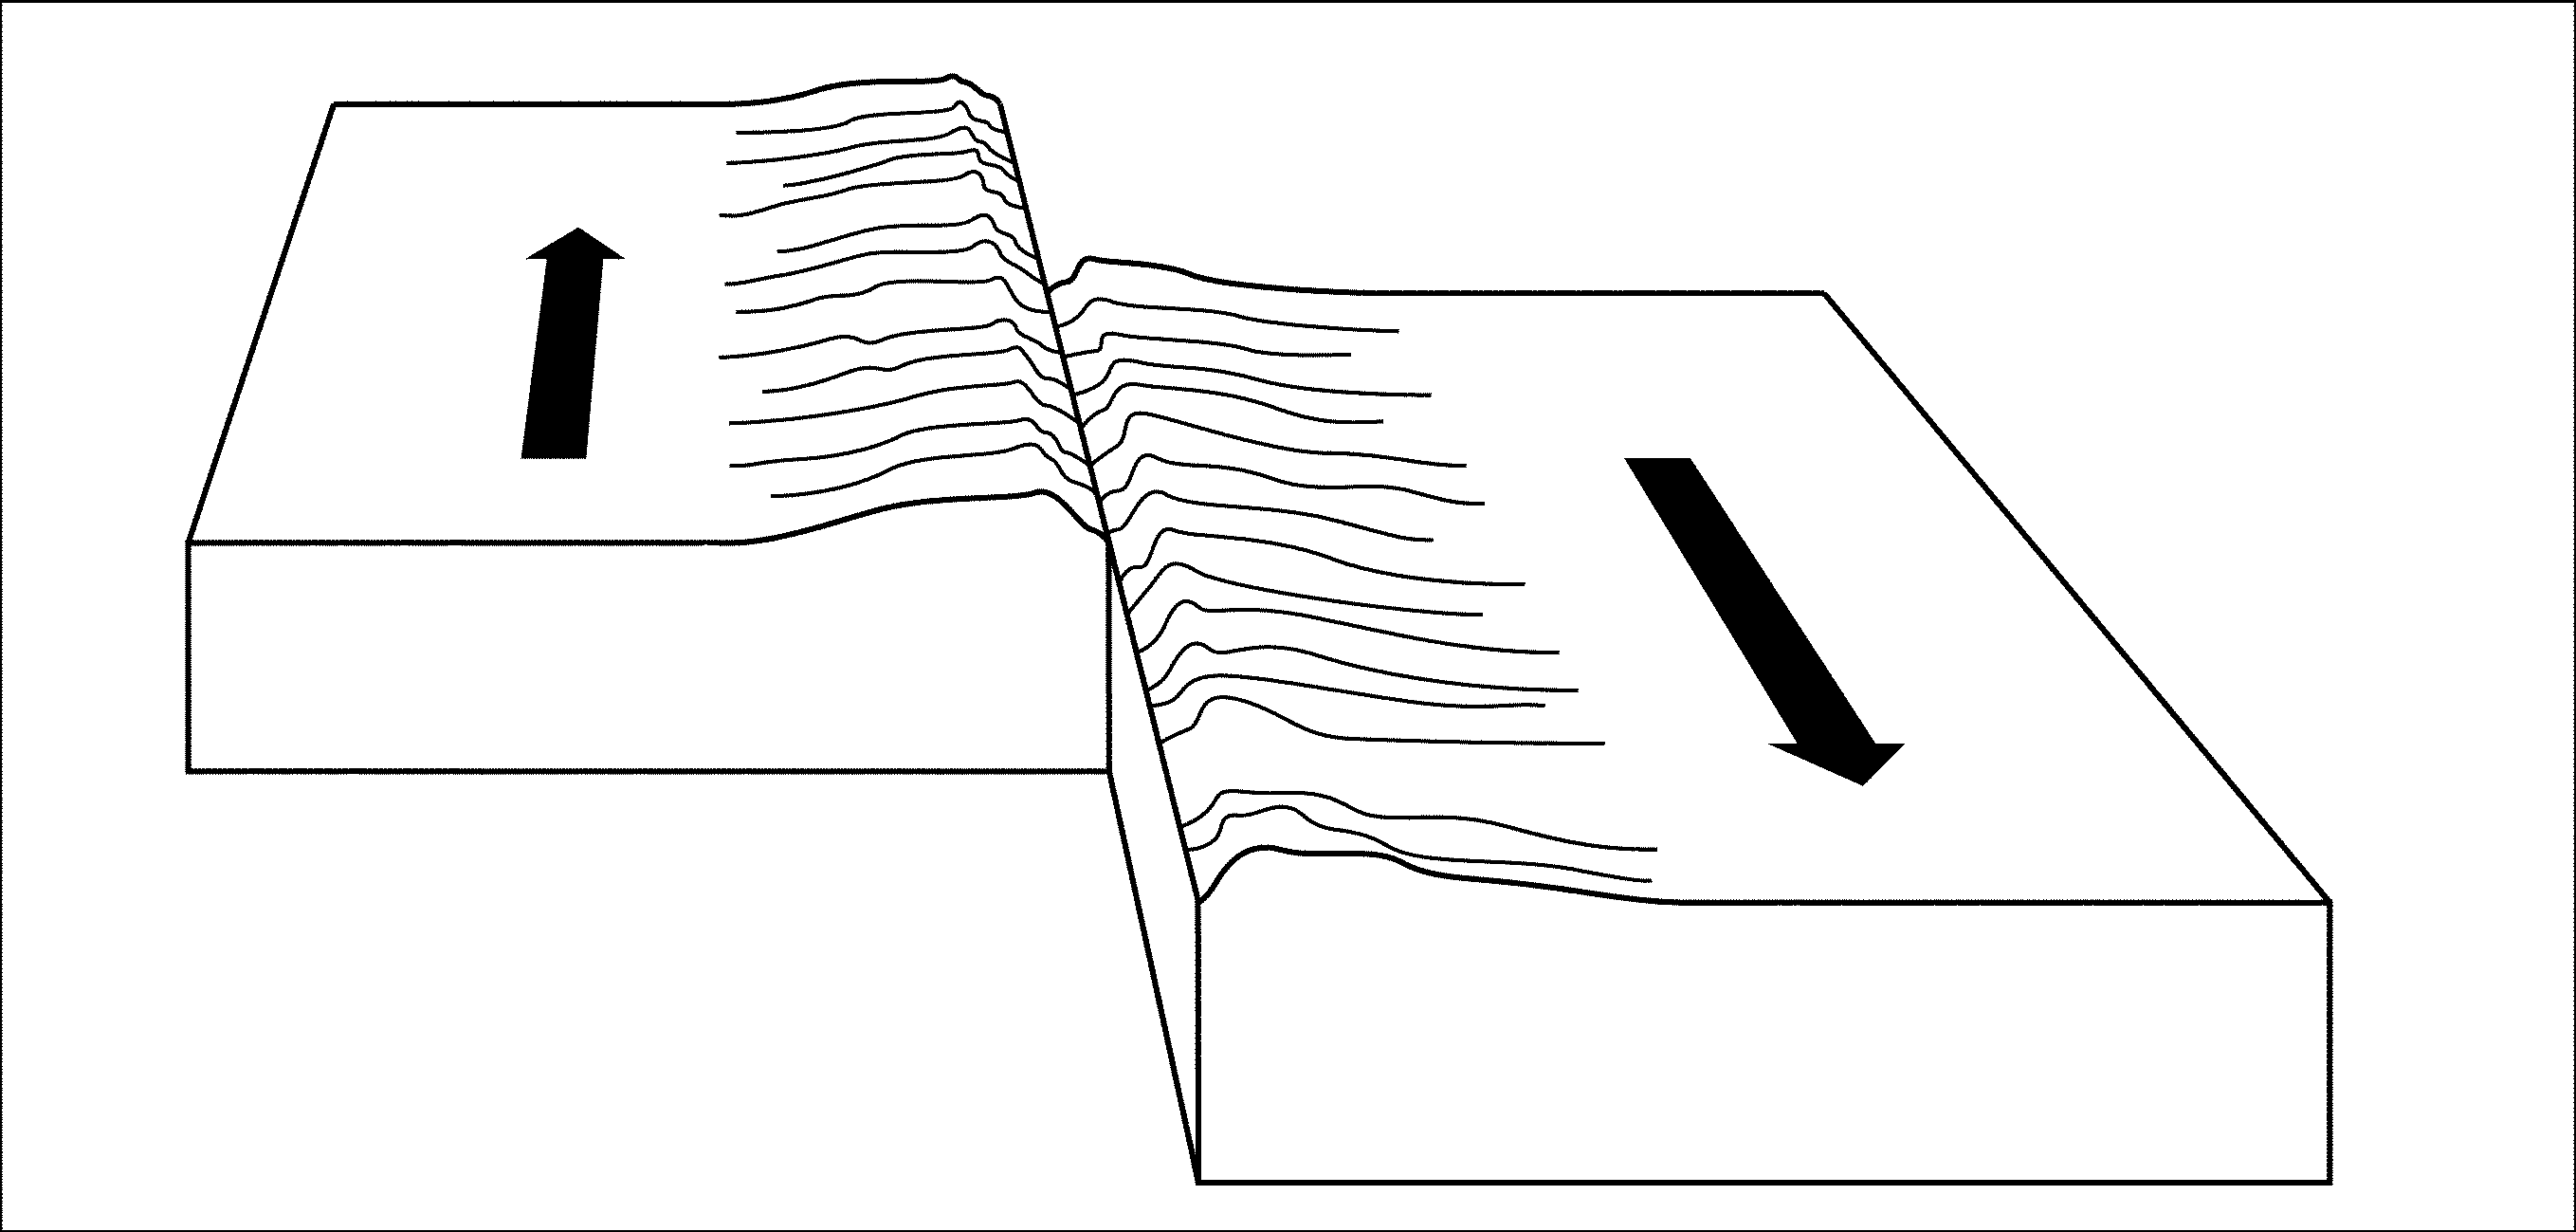
Figure 6

The strength of an earthquake is measured by a seismograph

Activity 1:

To build a model of an earthquake

[lo 2.1, 2.3]

Making a model of an earthquake: Work in groups.

  1. Obtain two equally thick wooden boards. Place them alongside one another. Use cardboard to make building blocks that can be used to represent bricks, houses or buildings. Place these blocks in position over the fault line (where the two wooden boards touch one another). Now draw the boards away from one another or slide them past each other in opposite directions.

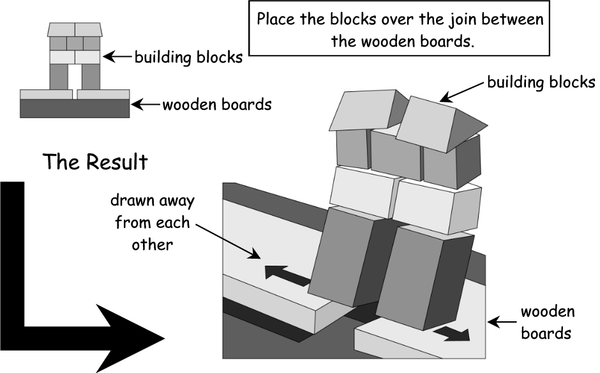
2. Explain what exactly happened to the blocks?

3. What are the names of the different parts of the earth’s crust (represented by the wooden boards)?

4. What would you suggest for making buildings more Earthquake proof? Discuss this in your group and report your suggestions to the class.

Where do most earthquakes occur?

Earthquakes mainly occur at the margins of ground-plates, which is where these plates are slowly moving towards or away from each other. The movement causes earthquakes to occur in the countries that lie above the margins of the plates, while countries that lie towards the centres of the plates are not seriously threatened by earthquakes.

Questions & Answers

differentiate between demand and supply giving examples
Lambiv Reply
differentiated between demand and supply using examples
Lambiv
what is labour ?
Lambiv
how will I do?
Venny Reply
how is the graph works?I don't fully understand
Rezat Reply
information
Eliyee
devaluation
Eliyee
t
WARKISA
hi guys good evening to all
Lambiv
multiple choice question
Aster Reply
appreciation
Eliyee
explain perfect market
Lindiwe Reply
In economics, a perfect market refers to a theoretical construct where all participants have perfect information, goods are homogenous, there are no barriers to entry or exit, and prices are determined solely by supply and demand. It's an idealized model used for analysis,
Ezea
What is ceteris paribus?
Shukri Reply
other things being equal
AI-Robot
When MP₁ becomes negative, TP start to decline. Extuples Suppose that the short-run production function of certain cut-flower firm is given by: Q=4KL-0.6K2 - 0.112 • Where is quantity of cut flower produced, I is labour input and K is fixed capital input (K-5). Determine the average product of lab
Kelo
Extuples Suppose that the short-run production function of certain cut-flower firm is given by: Q=4KL-0.6K2 - 0.112 • Where is quantity of cut flower produced, I is labour input and K is fixed capital input (K-5). Determine the average product of labour (APL) and marginal product of labour (MPL)
Kelo
yes,thank you
Shukri
Can I ask you other question?
Shukri
what is monopoly mean?
Habtamu Reply
What is different between quantity demand and demand?
Shukri Reply
Quantity demanded refers to the specific amount of a good or service that consumers are willing and able to purchase at a give price and within a specific time period. Demand, on the other hand, is a broader concept that encompasses the entire relationship between price and quantity demanded
Ezea
ok
Shukri
how do you save a country economic situation when it's falling apart
Lilia Reply
what is the difference between economic growth and development
Fiker Reply
Economic growth as an increase in the production and consumption of goods and services within an economy.but Economic development as a broader concept that encompasses not only economic growth but also social & human well being.
Shukri
production function means
Jabir
What do you think is more important to focus on when considering inequality ?
Abdisa Reply
any question about economics?
Awais Reply
sir...I just want to ask one question... Define the term contract curve? if you are free please help me to find this answer 🙏
Asui
it is a curve that we get after connecting the pareto optimal combinations of two consumers after their mutually beneficial trade offs
Awais
thank you so much 👍 sir
Asui
In economics, the contract curve refers to the set of points in an Edgeworth box diagram where both parties involved in a trade cannot be made better off without making one of them worse off. It represents the Pareto efficient allocations of goods between two individuals or entities, where neither p
Cornelius
In economics, the contract curve refers to the set of points in an Edgeworth box diagram where both parties involved in a trade cannot be made better off without making one of them worse off. It represents the Pareto efficient allocations of goods between two individuals or entities,
Cornelius
Suppose a consumer consuming two commodities X and Y has The following utility function u=X0.4 Y0.6. If the price of the X and Y are 2 and 3 respectively and income Constraint is birr 50. A,Calculate quantities of x and y which maximize utility. B,Calculate value of Lagrange multiplier. C,Calculate quantities of X and Y consumed with a given price. D,alculate optimum level of output .
Feyisa Reply
Answer
Feyisa
c
Jabir
the market for lemon has 10 potential consumers, each having an individual demand curve p=101-10Qi, where p is price in dollar's per cup and Qi is the number of cups demanded per week by the i th consumer.Find the market demand curve using algebra. Draw an individual demand curve and the market dema
Gsbwnw Reply
suppose the production function is given by ( L, K)=L¼K¾.assuming capital is fixed find APL and MPL. consider the following short run production function:Q=6L²-0.4L³ a) find the value of L that maximizes output b)find the value of L that maximizes marginal product
Abdureman
types of unemployment
Yomi Reply
What is the difference between perfect competition and monopolistic competition?
Mohammed
Got questions? Join the online conversation and get instant answers!
Jobilize.com Reply

Get Jobilize Job Search Mobile App in your pocket Now!

Get it on Google Play Download on the App Store Now


Source:  OpenStax, Geography grade 7. OpenStax CNX. Sep 09, 2009 Download for free at http://cnx.org/content/col11021/1.1
Google Play and the Google Play logo are trademarks of Google Inc.

Notification Switch

Would you like to follow the 'Geography grade 7' conversation and receive update notifications?

Ask