| << Chapter < Page | Chapter >> Page > |
HOW DRAWINGS AND DIAGRAMS CAN HELP YOU TO HAVE A BETTER UNDERSTANDING OF THE HISTORY OF YOUR PROVINCE
BACKGROUND INFORMATION FOR YOU!
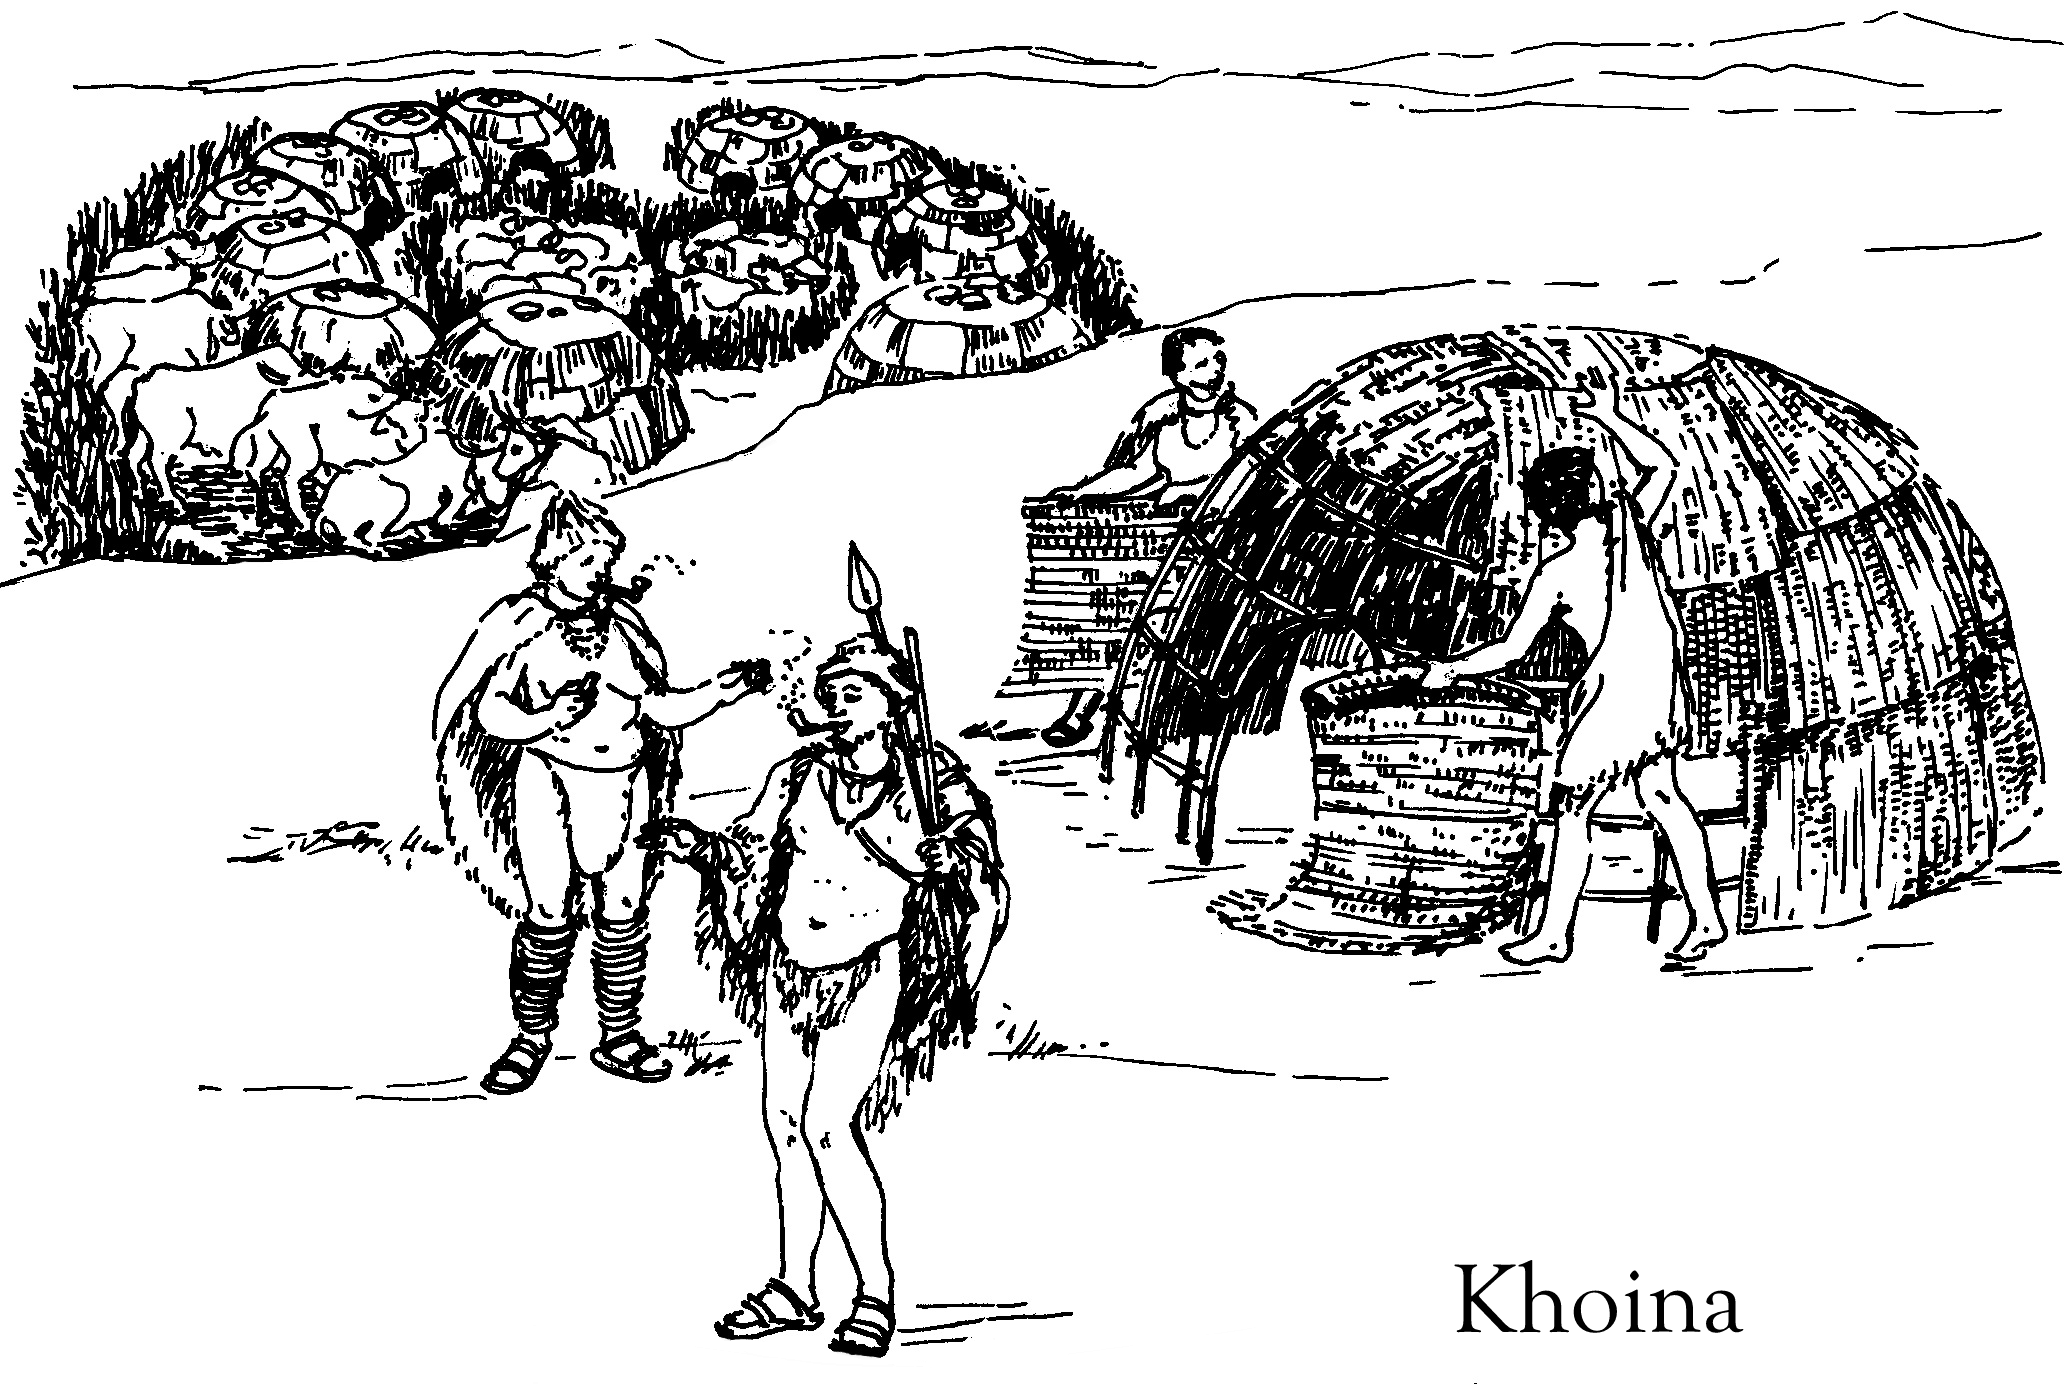
About 2 000 years ago the Khoina, most of whom were herdsmen, arrived in South Africa from the north. Because of their livestock, they lived in areas where there was enough grazing for their sheep and cattle and where they could hunt and gather food. They lived in large groups and often had to trek around. They therefore had few possessions. Huts were built with long curved slats, covered with reed mats on the outside. They rubbed cow dung and blood on the floors and built an enclosure outside the hut. At night they slept on reed mats. Pots and milk pails, like everything else, were designed to be fastened across the backs of animals when they travelled.
Study the following sources and answer the questions.
SOURCE A
SOURCE B
The Khoina used the following articles from their environment to stay alive.
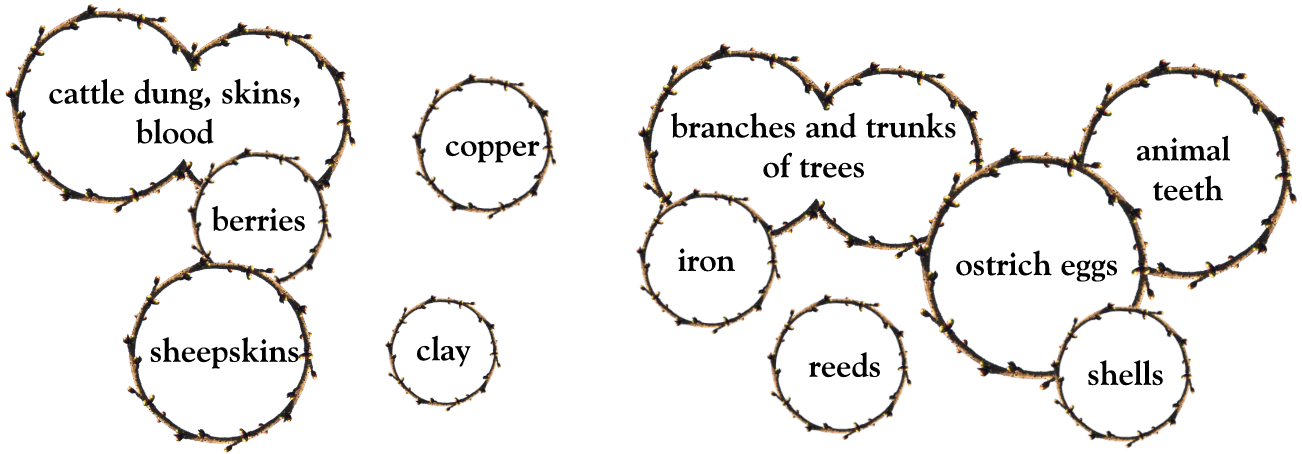
Do you know how they made the following items? You may select materials from the list.
| huts | tree trunks, reeds, lay, animal hides | |
| clothes | ||
| necklaces | ||
| weapons | ||
| pipes | ||
| containers | ||
| pots | ||
| footwear |
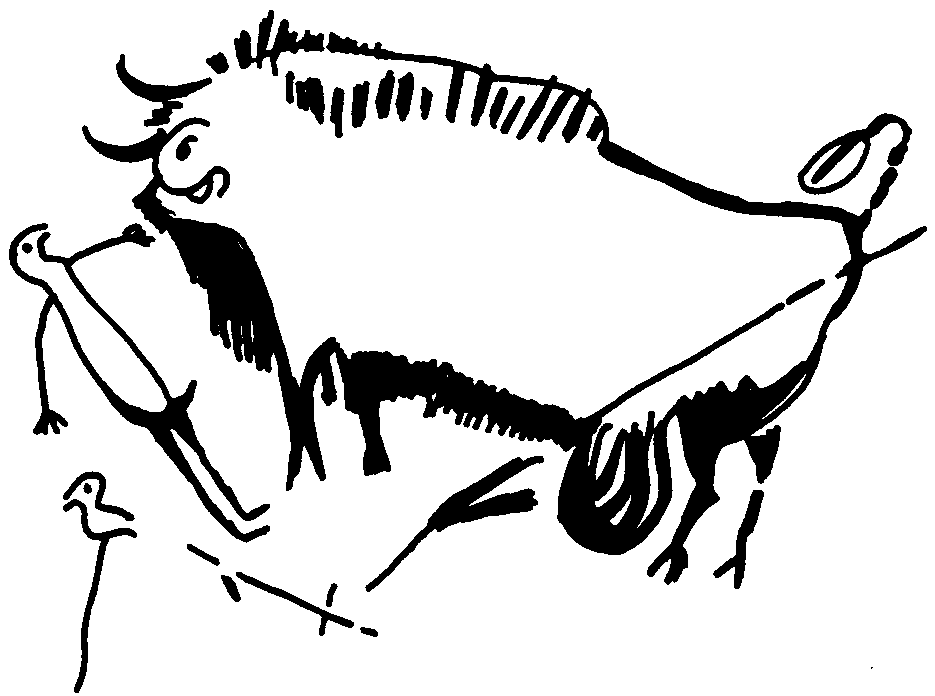
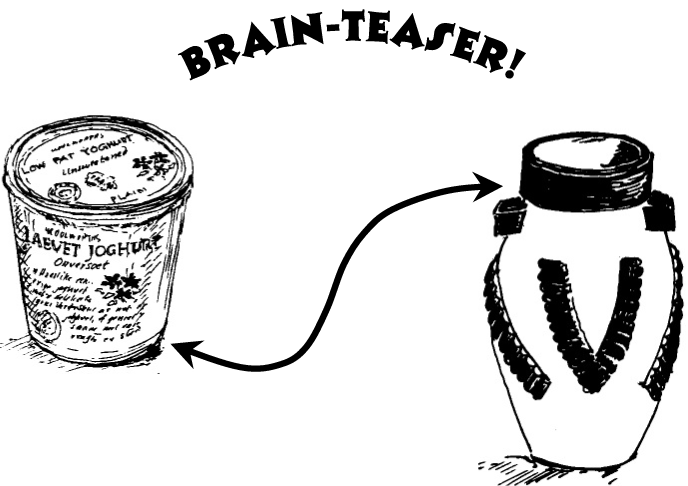
What is the connection?
Which herbs do you use in the kitchen?
DUTCH FARMERS
As you know, the D.E.I.C. became a very powerful trading company. Many of their ships sailed from Europe to the East. In 1652 Jan van Riebeeck was sent to establish a halfway station at the Cape.
In 1657 he gave permission to the first nine farmers (Free Burghers) to start farming on small farms. By doing so, the D.E.I.C hoped to be able to supply ships with enough fruit, vegetables and grain, and to reduce their expenses. The D.E.I.C bought products from the Free Burghers at fixed prices. As the Free Burghers increased in number, they also became involved in other agricultural activities.
(b) Also study the following statistics on the farming activities of the Free Burghers. Then state whether the claims are true or false. If untrue, supply the correct facts.
| YEAR | CATTLE | SHEEP | WINE (LEAGUER) | WHEAT (BAGS) |
| 1711 | 20 743 | 116 256 | 1 094 | 20 526 |
| 1713 | 16 557 | 120 208 | 1 617 | 12 360 |
| 1783 | 62 762 | 310 904 | 3 239 | 14 983 |
| 1788 | 80 921 | 445 557 | 7 186 | 22 280 |
| 1795 | 71 664 | 418 817 | 6 271 | 32 936 |
Adapted from : H.J. van Aswegen, Geskiedenis van S.A. tot 1854 , p. 93.
1. In 1713 wheat farmers changed to cattle farming.
2. The decrease in wheat production from 1711 tot 1713 was due to droughts, untimely rain or diseases.
3. From 1788 the government had to import wheat due to a shortage.
In 1780, when there were approximately 10 500 Free Burghers, the D.E.I.C. controlled the territory up to the Orange River in the north, and the Fish River in the east.
Farmers tilled the land for one year and then let it lie fallow during the following year. Everyone worked from sunrise to sunset. The heavy plough was pulled by oxen. Wheat, harvested from December, was tied in small bundles and stacked. The southeaster usually assisted in the threshing of the wheat. Afterwards the grain was cleaned, measured, put into bags and immediately taken to town or to the miller.

(c) Now design your own advertisement to indicate that you need workers on your wheat farm.
Most families were large. There were also squatters ("bywoners"), mainly Khoina servants. Wealthier farmers owned slaves. The women raised the children (sometimes teaching them) and had to prepare the meals. The men usually looked after the cattle or hunted on horseback. They produced their own dried fruit, butter, soap and animal skins. Coffee, tea, sugar, rifles, powder and lead were very scarce and were mainly bought from traders. Remember: a journey to Cape Town took about three months!
(d) GROUP WORK!!
Divide into groups and study the following drawings. Each member of the group takes a turn to ask a question with regard to a drawing. The group must answer. Do not ask questions that require yes or no answers. The group leader should write down any unanswered questions so that they can be put to the class!

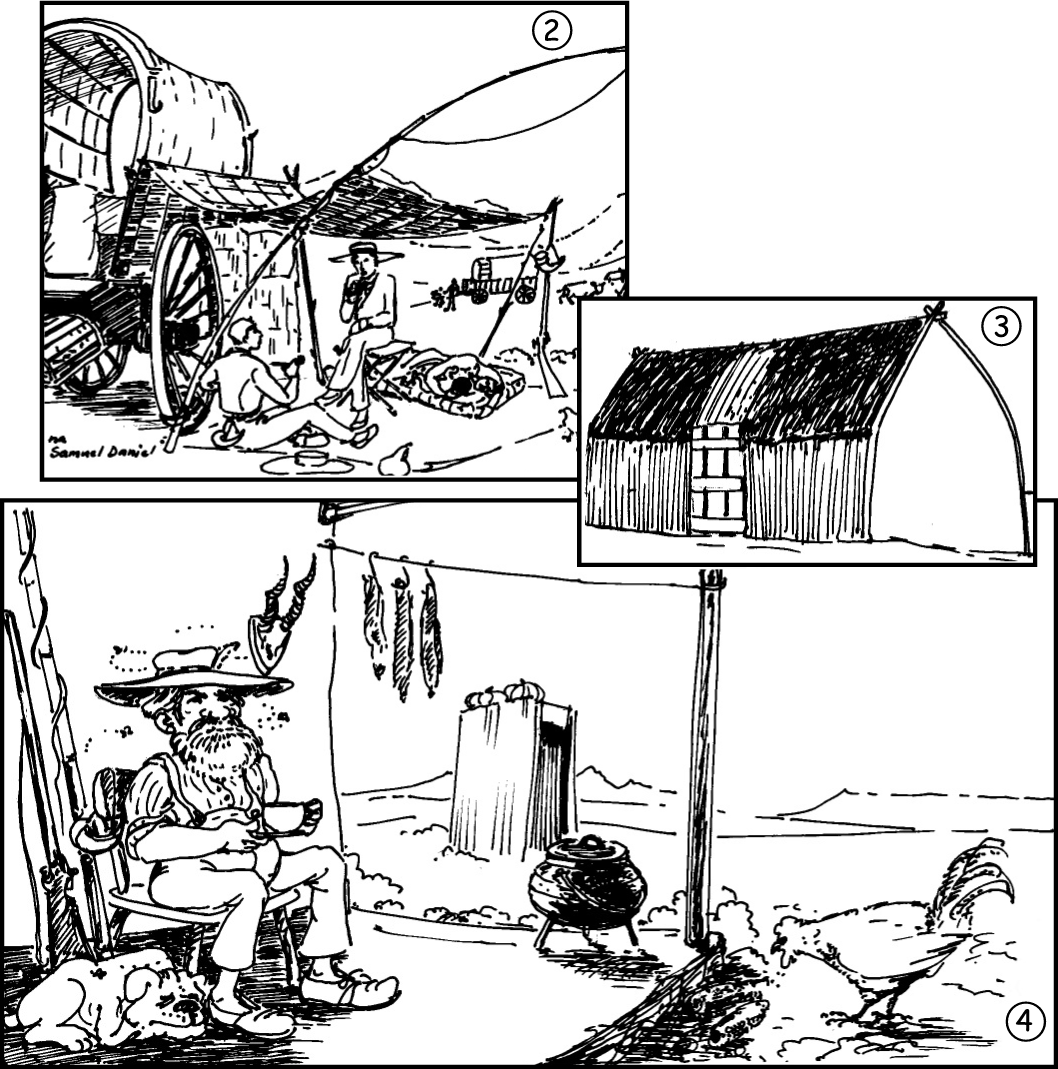
(e) Design your own comic strip to describe a day in the life of a stockfarmer family.
LO 1
HISTORICAL ENQUIRY The learner will be to use enquiry skills to investigate the past and present.
We know this when the learner:
1.1 finds sources:
with guidance, selects sources useful for finding information on the past (e.g. oral, written and visual sources, including maps, graphs and tables, objects, buildings, monuments, museums);
1.2 works with sources:
records and categorises information from a variety of sources (e.g. oral, written and visual sources, including maps, graphs and tables, objects, buildings, monuments, museums);
1.3 answers the question:
ACTIVITY
| Clothing | Skins, reeds and grass (hats, baskets) |
| Necklace | Seeds, small leather pouches filled with pebbles, shells, reed, horn |
| Weapons | Bone, stone, branches, poison, leather, kierie, traps |
| Pipe | Wood |
| Containers, pots | Leather bags, tortoise shells |
| Footwear | Wood |
b)

Notification Switch
Would you like to follow the 'Social sciences: history grade 5' conversation and receive update notifications?