<< Chapter < Page
  Digital signal processing - dsp     Page 13 / 14
Chapter >> Page >

For simplicity, let's assume that the sampling frequency was one sample per second. This causes the sinusoid to have a period of 32 seconds and a frequency of 0.03125 cycles per second.

At a sampling rate of one sample per second, the folding frequency occurs at 0.5 cycles per second.

The computational frequency interval

Dividing the folding frequency by 400 we conclude that the Fourier transform program computed a spectral value every 0.00125 cycles per second. Given thatevery second spectral value is zero, the zero values occur every 0.00250 cycles per second.

Let's compute the average of some products

The top plot in Figure 14 shows the result of multiplying a cosine function having a frequency of 0.03125 cycles per second (the frequency of the sinusoid in the previous spectral analysis experiment) by a sine function having a frequency of 0.02875 cycles per second.

(This replicates one of the steps in the computation of the imaginary value in the Fourier transform).

Figure 14. Average values of sinusoid products.
missing image

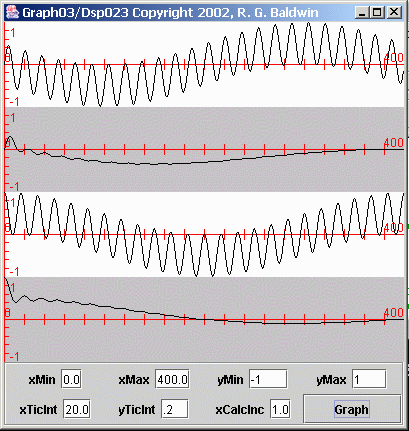
The difference between the frequencies of the cosine function and the sine function is 0.00250 cycles per second.

(Note that this frequency difference is the reciprocal of the actual number of samples in the earlier time series, which contained 400 samples.This is also the frequency interval on which the Fourier transform produced zero-valued points for the bottom plot in Figure 11 .)

The average of the product time series

The second plot in Figure 14 shows the average value of the time series in the first plot versus the number of samples included in the averaging window.

(This replicates another step in the computation of the imaginary value in the Fourier transform).

It is very important to note that this average plot goes to zero when 400 samples are included in the average.

Product of two cosine functions

Similarly, the third plot in Figure 14 shows the product of the same cosine function as above and another cosine function having the same frequency as thesine function described above.

(This replicates a step in the computation of the real value in the Fourier transform).

The average of the product time series

The fourth plot in Figure 14 shows the average value of the time series in the third plot.

(This replicates another step in the computation of the real value in the Fourier transform).

This average plot goes to zero at an averaging window of about 200 samples, and again at an averaging window of 400 samples.

Where do the zero values match?

The first point at which both average plots go to zero at the same point on the horizontal axis is at an averaging window of 400 samples.

(Both the real and imaginary values must go to zero in order for the spectral value produced by the Fourier transform to go to zero.)

Zero values in the spectrum for a sinusoid

Thus, the values produced by performing a Fourier transform on a single sinusoid go through zero at regular frequency intervals out from the peak inboth directions. The frequency intervals between the zero values are multiples of the reciprocal of the actual length of the sinusoid on which the transform isperformed.

Questions & Answers

it is the relatively stable flow of income
Chidubem Reply
what is circular flow of income
Divine Reply
branches of macroeconomics
SHEDRACK Reply
what is Flexible exchang rate?
poudel Reply
is gdp a reliable measurement of wealth
Atega Reply
introduction to econometrics
Husseini Reply
Hi
mostafa
hi
LEMLEM
hello
Sammol
hi
Mahesh
bi
Ruqayat
hi
Ruqayat
Hi fellas
Nyawa
hey
Sammol
hi
God
hello
Jahara
Good morning
Jorge
hi
abubakar
hi
Nmesoma
hi
Mahesh
Hi
Tom
Why is unemployment rate never zero at full employment?
Priyanka Reply
bcoz of existence of frictional unemployment in our economy.
Umashankar
what is flexible exchang rate?
poudel
due to existence of the pple with disabilities
Abdulraufu
the demand of a good rises, causing the demand for another good to fall
Rushawn Reply
is it possible to leave every good at the same level
Joseph
I don't think so. because check it, if the demand for chicken increases, people will no longer consume fish like they used to causing a fall in the demand for fish
Anuolu
is not really possible to let the value of a goods to be same at the same time.....
Salome
Suppose the inflation rate is 6%, does it mean that all the goods you purchase will cost 6% more than previous year? Provide with reasoning.
Geetha Reply
Not necessarily. To measure the inflation rate economists normally use an averaged price index of a basket of certain goods. So if you purchase goods included in the basket, you will notice that you pay 6% more, otherwise not necessarily.
Waeth
discus major problems of macroeconomics
Alii Reply
what is the problem of macroeconomics
Yoal
Economic growth Stable prices and low unemployment
Ephraim
explain inflationcause and itis degre
Miresa Reply
what is inflation
Getu
increase in general price levels
WEETO
Good day How do I calculate this question: C= 100+5yd G= 2000 T= 2000 I(planned)=200. Suppose the actual output is 3000. What is the level of planned expenditures at this level of output?
Chisomo Reply
how to calculate actual output?
Chisomo
how to calculate the equilibrium income
Beshir
Criteria for determining money supply
Thapase Reply
who we can define macroeconomics in one line
Muhammad
Aggregate demand
Mohammed
C=k100 +9y and i=k50.calculate the equilibrium level of output
Mercy Reply
Hi
Isiaka
Hi
Geli
hy
Man
👋
Bahunda
hy how are you?
Man
ys
Amisha
how are you guys
Sekou
f9 guys
Amisha
how are you guys
Sekou
ys am also fine
Amisha
fine and you guys
Geli
from Nepal
Amisha
nawalparasi district from belatari
Amisha
nd u
Amisha
I am Camara from Guinea west Africa... happy to meet you guys here
Sekou
ma management ho
Amisha
ahile becheclor ho
Amisha
hjr ktm bta ho ani k kaam grnu hunxa tw
Amisha
belatari
Amisha
1st year ho
Amisha
nd u
Amisha
ahh
Amisha
kaha biratnagar
Amisha
ys
Amisha
kina k vo
Amisha
money as unit of account means what?
Kalombe
A unit of account is something that can be used to value goods and services and make calculations
Jim
all of you please speak in English I can't understand you're language
Muhammad
I want to know how can we define macroeconomics in one line
Muhammad
it must be .9 or 0.9 no Mpc is greater than 1 Y=100+.9Y+50 Y-.9Y=150 0.1Y/0.1=150/0.1 Y=1500
Kalombe
Mercy is it clear?😋
Kalombe
hi can someone help me on this question If a negative shocks shifts the IS curve to the left, what type of policy do you suggest so as to stabilize the level of output? discuss your answer using appropriate graph.
Galge Reply
if interest rate is increased this will will reduce the level of income shifting the curve to the left ◀️
Kalombe
Got questions? Join the online conversation and get instant answers!
Jobilize.com Reply

Get Jobilize Job Search Mobile App in your pocket Now!

Get it on Google Play Download on the App Store Now


Source:  OpenStax, Digital signal processing - dsp. OpenStax CNX. Jan 06, 2016 Download for free at https://legacy.cnx.org/content/col11642/1.38
Google Play and the Google Play logo are trademarks of Google Inc.

Notification Switch

Would you like to follow the 'Digital signal processing - dsp' conversation and receive update notifications?

Ask