| << Chapter < Page | Chapter >> Page > |
In effect, Vivian can choose whether to receive the benefits of her wage increase in the form of more income, or more leisure, or some mixture of these two. With this range of possibilities, it would be unwise to assume that Vivian (or anyone else) will necessarily react to a wage increase by working substantially more hours. Maybe they will; maybe they will not.
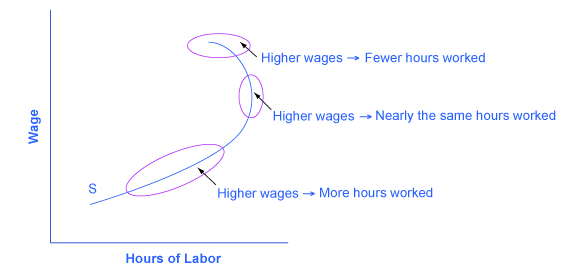
The theoretical insight that higher wages will sometimes cause an increase in hours worked, sometimes cause hours worked not to change by much, and sometimes cause hours worked to decline, has led to labor supply curves that look like the one in [link] . The bottom-left portion of the labor supply curve slopes upward, which reflects the situation of a person who reacts to a higher wage by supplying a greater quantity of labor. The middle, close-to-vertical portion of the labor supply curve reflects the situation of a person who reacts to a higher wage by supplying about the same quantity of labor. The very top portion of the labor supply curve is called a backward-bending supply curve for labor , which is the situation of high-wage people who can earn so much that they respond to a still-higher wage by working fewer hours. Read the following Clear It Up feature for more on the number of hours the average person works each year.

Americans work a lot. [link] shows average hours worked per year in the United States, Canada, Japan, and several European countries, with data from 2013. To get a perspective on these numbers, someone who works 40 hours per week for 50 weeks per year, with two weeks off, would work 2,000 hours per year. The gap in hours worked is a little astonishing; the 250 to 300 hour gap between how much Americans work and how much Germans or the French work amounts to roughly six to seven weeks less of work per year. Economists who study these international patterns debate the extent to which average Americans and Japanese have a preference for working more than, say, Germans, or whether German workers and employers face particular kinds of taxes and regulations that lead to fewer hours worked. Many countries have laws that regulate the work week and dictate holidays and the standards of “normal” vacation time vary from country to country. It is also interesting to take the amount of time spent working in context; it is estimated that in the late nineteenth century in the United States, the average work week was over 60 hours per week—leaving little to no time for leisure.
| Country | Average Annual Hours Actually Worked per Employed Person |
|---|---|
| United States | 1,824 |
| Spain | 1,799 |
| Japan | 1,759 |
| Canada | 1,751 |
| United Kingdom | 1,669 |
| Sweden | 1,585 |
| Germany | 1,443 |
| France | 1,441 |
The different responses to a rise in wages—more hours worked, the same hours worked, or fewer hours worked—are patterns exhibited by different groups of workers in the U.S. economy. Many full-time workers have jobs where the number of hours is held relatively fixed, partly by their own choice and partly by their employer’s practices. These workers do not much change their hours worked as wages rise or fall, so their supply curve of labor is inelastic. However, part-time workers and younger workers tend to be more flexible in their hours, and more ready to increase hours worked when wages are high or cut back when wages fall.
The backward-bending supply curve for labor, when workers react to higher wages by working fewer hours and having more income, is not observed often in the short run. However, some well-paid professionals, like dentists or accountants, may react to higher wages by choosing to limit the number of hours, perhaps by taking especially long vacations, or taking every other Friday off. Over a long-term perspective, the backward-bending supply curve for labor is common. Over the last century, Americans have reacted to gradually rising wages by working fewer hours; for example, the length of the average work-week has fallen from about 60 hours per week in 1900 to the present average of less than 40 hours per week.
Recognizing that workers have a range of possible reactions to a change in wages casts some fresh insight on a perennial political debate: the claim that a reduction in income taxes—which would, in effect, allow people to earn more per hour—will encourage people to work more. The leisure-income budget set points out that this connection will not hold true for all workers. Some people, especially part-timers, may react to higher wages by working more. Many will work the same number of hours. Some people, especially those whose incomes are already high, may react to the tax cut by working fewer hours. Of course, cutting taxes may be a good or a bad idea for a variety of reasons, not just because of its impact on work incentives, but the specific claim that tax cuts will lead people to work more hours is only likely to hold for specific groups of workers and will depend on how and for whom taxes are cut.
When making a choice along the labor-leisure budget constraint, a household will choose the combination of labor, leisure, and income that provides the most utility. The result of a change in wage levels can be higher work hours, the same work hours, or lower work hours.

Notification Switch
Would you like to follow the 'Microeconomics' conversation and receive update notifications?