<< Chapter < Page
  Digital signal processing - dsp     Page 7 / 24
Chapter >> Page >

(The color black could also be dedicated to identifying the lowest elevation in the design of the Color Contour plot, in which case, bothschemes would be equal in this regard.)

As we learned earlier, the lowest elevation occurs at four different points on the surface, and those points are near the corners.

The elevation of the valleys

Both plots show that while the valleys between the central and minor peaks are very deep, they aren't quite as deep as the lowest elevation. They are bluein the Color Shift plot and gray in the Color Contour plot. Because the gray color represents a somewhat smaller elevation range in the Color Contour plotthan the blue represents in the Color Shift plot, the elevation of the valley is defined more accurately in the Color Contour plot.

A logarithmic conversion

Sometimes when plotting data, it is useful to plot the logarithm of the data values instead of the raw values.

(For many years, engineers have plotted data on graph paper referred to either as semi-log paper or log-log paper. Each type of graph paper hasadvantages and disadvantages relative to the other type and also has advantages and disadvantages relative to linear graph paper. This programprovides a capability that is analogous to the use of semi-log paper but in a 3D sense.)

Flattens the plot

The use of semi-log paper has the effect of flattening the plot in the 2D case, or flattening the surface in the 3D case. The semi-log approach tends topull the structure of the low-level values up so that they can be better observed. The logarithm of the low elevations is closer to the maximum elevationthan is the raw value of the low elevations.

More sample output

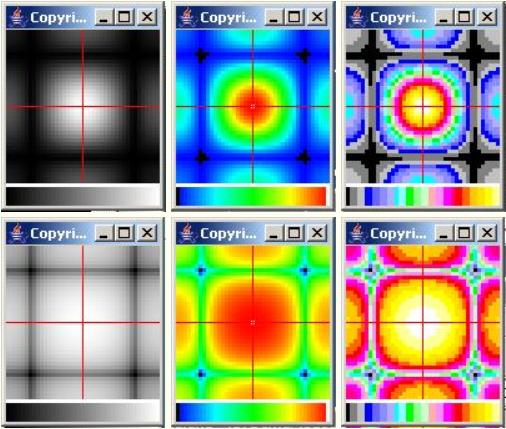
The three images in the top row of Figure 2 are reproductions of the three images in Figure 1 . They were included in Figure 2 for comparison with the bottom three images in Figure 2 .

Figure 2 . Sample output with logarithmic flattening.
Missing Figure.

The bottom three images in Figure 2 were produced in exactly the same way as the top three images except that prior to creating the image the elevationvalues for the surface were converted to the log base 10 of the raw elevation values.

Six different formats

Thus, Figure 2 shows the same 3D surface plotted using six different plotting formats. Going from left to right and top to bottom, the six images illustrate:

  • Grayscale (linear)
  • Color Shift (linear)
  • Color Contour (linear)
  • Grayscale with logarithmic data flattening
  • Color Shift with logarithmic data flattening
  • Color Contour with logarithmic data flattening

Isolates the location of the minima

The significance of the logarithmic conversion can be seen by comparing the two images on the right side of Figure 2 . When the raw elevation values were quantized into 23 levels, quite a few of the elevation values were quantizedinto the minimum value as indicated by the black areas in the top image.

However, after converting the elevation values to logarithmic values, only four points quantized to the minimum value as indicated by the four small blacksquares in the bottom right image. Thus, the top image on the right shows the general area of the lowest elevations on the surface whereas the bottom image onthe right clearly identifies the exact location of each of the four lowest elevations.

Questions & Answers

how does Neisseria cause meningitis
Nyibol Reply
what is microbiologist
Muhammad Reply
what is errata
Muhammad
is the branch of biology that deals with the study of microorganisms.
Ntefuni Reply
What is microbiology
Mercy Reply
studies of microbes
Louisiaste
when we takee the specimen which lumbar,spin,
Ziyad Reply
How bacteria create energy to survive?
Muhamad Reply
Bacteria doesn't produce energy they are dependent upon their substrate in case of lack of nutrients they are able to make spores which helps them to sustain in harsh environments
_Adnan
But not all bacteria make spores, l mean Eukaryotic cells have Mitochondria which acts as powerhouse for them, since bacteria don't have it, what is the substitution for it?
Muhamad
they make spores
Louisiaste
what is sporadic nd endemic, epidemic
Aminu Reply
the significance of food webs for disease transmission
Abreham
food webs brings about an infection as an individual depends on number of diseased foods or carriers dully.
Mark
explain assimilatory nitrate reduction
Esinniobiwa Reply
Assimilatory nitrate reduction is a process that occurs in some microorganisms, such as bacteria and archaea, in which nitrate (NO3-) is reduced to nitrite (NO2-), and then further reduced to ammonia (NH3).
Elkana
This process is called assimilatory nitrate reduction because the nitrogen that is produced is incorporated in the cells of microorganisms where it can be used in the synthesis of amino acids and other nitrogen products
Elkana
Examples of thermophilic organisms
Shu Reply
Give Examples of thermophilic organisms
Shu
advantages of normal Flora to the host
Micheal Reply
Prevent foreign microbes to the host
Abubakar
they provide healthier benefits to their hosts
ayesha
They are friends to host only when Host immune system is strong and become enemies when the host immune system is weakened . very bad relationship!
Mark
what is cell
faisal Reply
cell is the smallest unit of life
Fauziya
cell is the smallest unit of life
Akanni
ok
Innocent
cell is the structural and functional unit of life
Hasan
is the fundamental units of Life
Musa
what are emergency diseases
Micheal Reply
There are nothing like emergency disease but there are some common medical emergency which can occur simultaneously like Bleeding,heart attack,Breathing difficulties,severe pain heart stock.Hope you will get my point .Have a nice day ❣️
_Adnan
define infection ,prevention and control
Innocent
I think infection prevention and control is the avoidance of all things we do that gives out break of infections and promotion of health practices that promote life
Lubega
Heyy Lubega hussein where are u from?
_Adnan
en français
Adama
which site have a normal flora
ESTHER Reply
Many sites of the body have it Skin Nasal cavity Oral cavity Gastro intestinal tract
Safaa
skin
Asiina
skin,Oral,Nasal,GIt
Sadik
How can Commensal can Bacteria change into pathogen?
Sadik
How can Commensal Bacteria change into pathogen?
Sadik
all
Tesfaye
by fussion
Asiina
what are the advantages of normal Flora to the host
Micheal
what are the ways of control and prevention of nosocomial infection in the hospital
Micheal
what is inflammation
Shelly Reply
part of a tissue or an organ being wounded or bruised.
Wilfred
what term is used to name and classify microorganisms?
Micheal Reply
Binomial nomenclature
adeolu
Got questions? Join the online conversation and get instant answers!
Jobilize.com Reply

Get Jobilize Job Search Mobile App in your pocket Now!

Get it on Google Play Download on the App Store Now


Source:  OpenStax, Digital signal processing - dsp. OpenStax CNX. Jan 06, 2016 Download for free at https://legacy.cnx.org/content/col11642/1.38
Google Play and the Google Play logo are trademarks of Google Inc.

Notification Switch

Would you like to follow the 'Digital signal processing - dsp' conversation and receive update notifications?

Ask