

| << Chapter < Page | Chapter >> Page > |
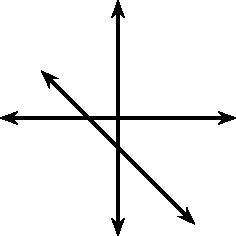
Functions with a general form of are called straight line functions. In the equation, , and are constants and have different effects on the graph of the function. The general shape of the graph of functions of this form is shown in [link] for the function .
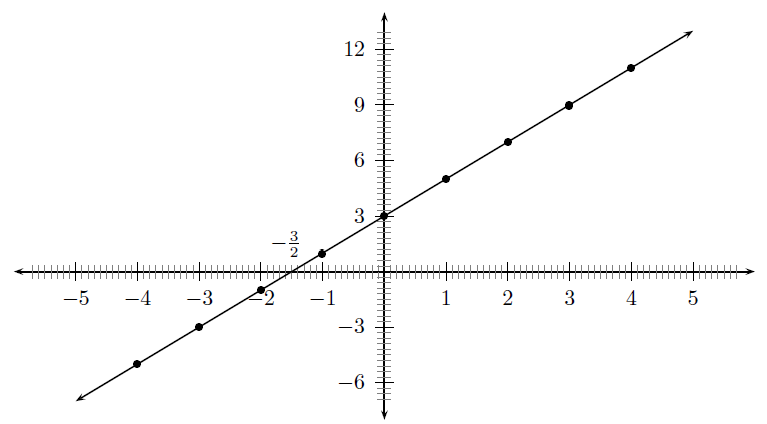
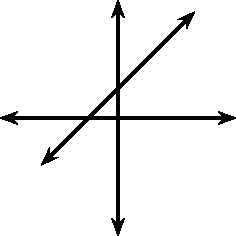
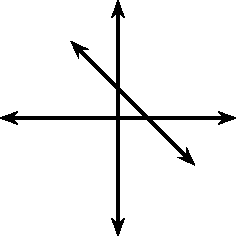
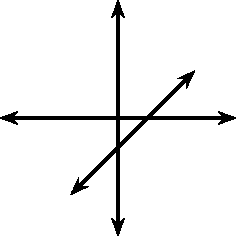
You may have noticed that the value of affects the slope of the graph. As increases, the slope of the graph increases. If then the graph increases from left to right (slopes upwards). If then the graph increases from right to left (slopes downwards). For this reason, is referred to as the slope or gradient of a straight-line function.
You should have also found that the value of affects where the graph passes through the -axis. For this reason, is known as the y-intercept .
These different properties are summarised in [link] .
 |
 | |
 |
 |
For , the domain is because there is no value of for which is undefined.
The range of is also because there is no value of for which is undefined.
For example, the domain of is because there is no value of for which is undefined. The range of is .
For functions of the form, , the details of calculating the intercepts with the and axis are given.
The -intercept is calculated as follows:
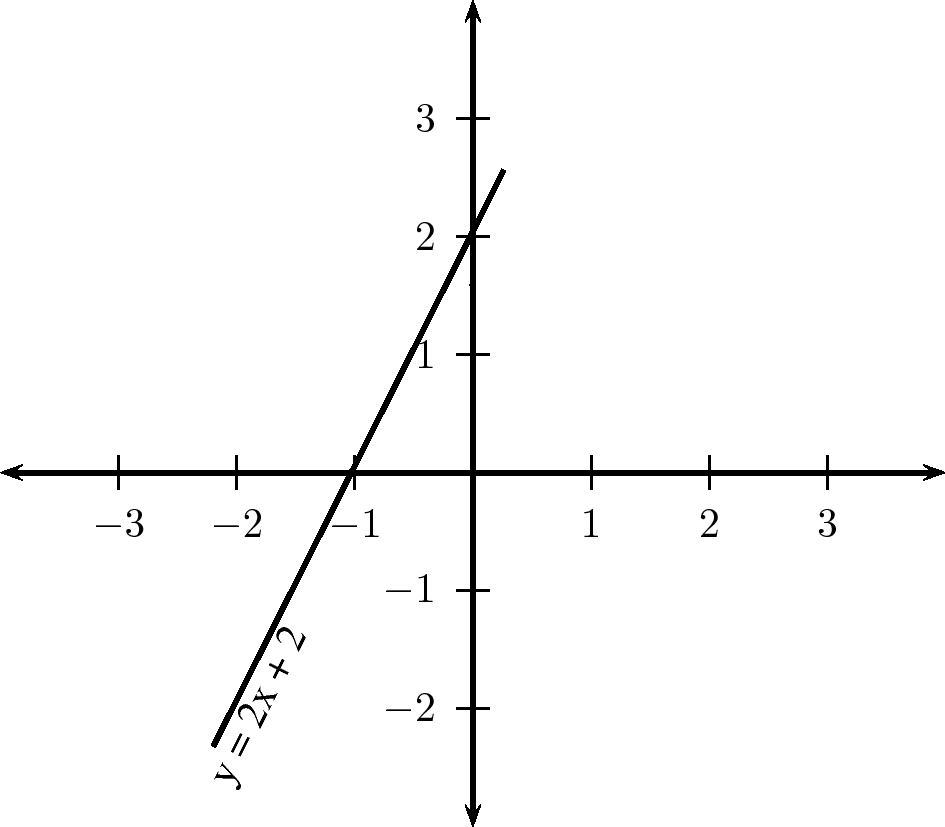
For example, the -intercept of is given by setting to get:
The -intercepts are calculated as follows:
For example, the -intercepts of is given by setting to get:
The graphs of straight line functions do not have any turning points.
The graphs of straight-line functions do not, generally, have any axes of symmetry.
In order to sketch graphs of the form, , we need to determine three characteristics:
Only two points are needed to plot a straight line graph. The easiest points to use are the -intercept (where the line cuts the -axis) and the -intercept.
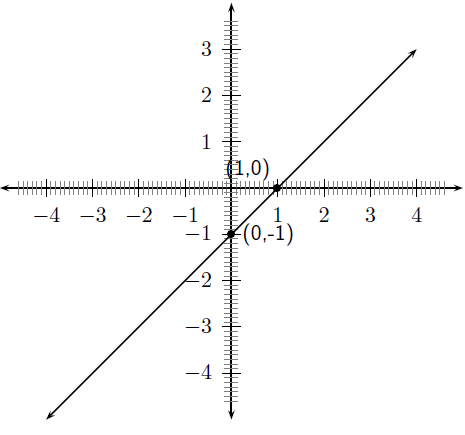
For example, sketch the graph of . Mark the intercepts.
Firstly, we determine that . This means that the graph will have an upward slope.
The -intercept is obtained by setting and was calculated earlier to be . The -intercept is obtained by setting and was calculated earlier to be .
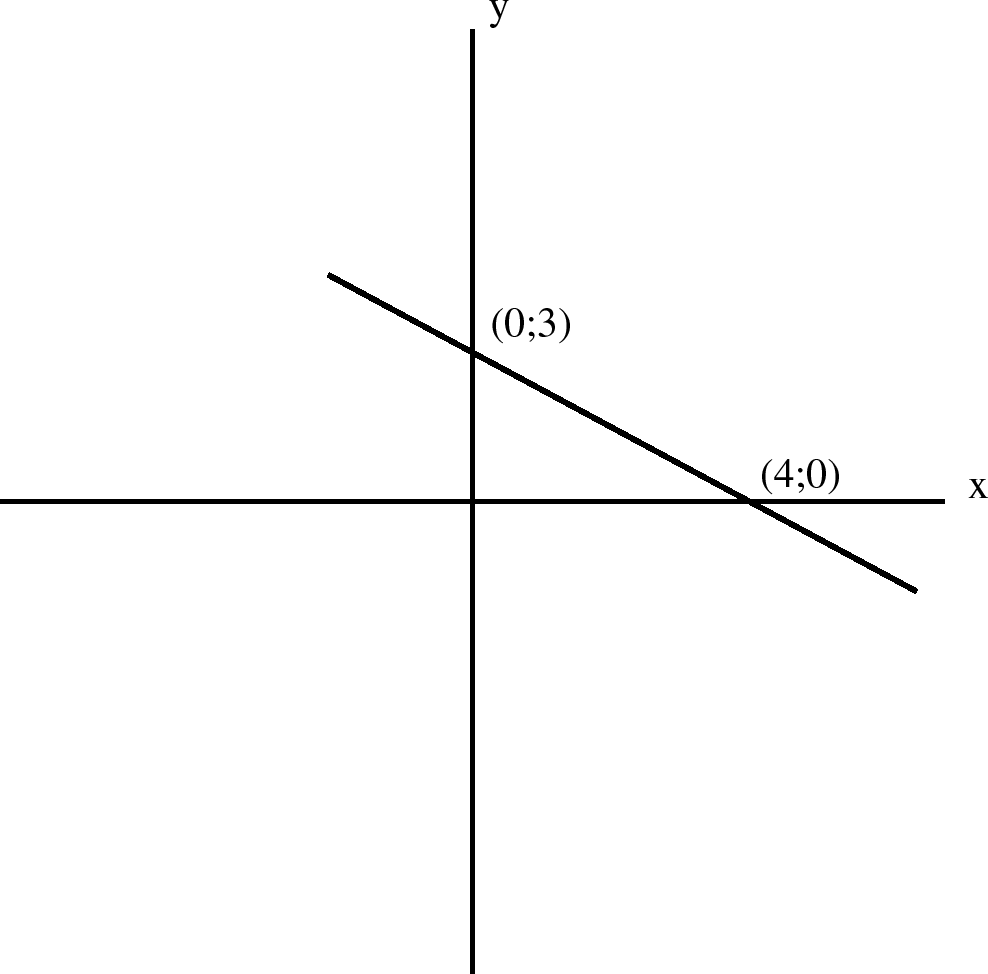
Draw the graph of
To find the intercept on the y-axis, let
For the intercept on the x-axis, let
Notification Switch
Would you like to follow the 'Siyavula textbooks: grade 10 maths [caps]' conversation and receive update notifications?

|
|

|
|

|
|

|
|

|
|

|
|

|
|

|
|

|
|

|