In Grade 10, you studied graphs of many different forms. In this chapter, you will learn a little more about the graphs of functions.
Functions of the form
This form of the hyperbolic function is slightly more complex than the form studied in Grade 10.
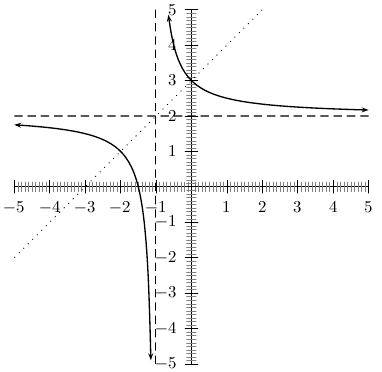
General shape and position of the graph of a function of the form
. The asymptotes are shown as dashed lines.
Investigation : functions of the form
On the same set of axes, plot the following graphs:
Use your results to deduce the effect of
.
On the same set of axes, plot the following graphs:
Use your results to deduce the effect of
.
Following the general method of the above activities, choose your own values of
and
to plot 5 different graphs of
to deduce the effect of
.
You should have found that the sign of
affects whether the graph is located in the first and third quadrants, or the second and fourth quadrants of Cartesian plane.
You should have also found that the value of
affects whether the
-intercept is negative (
) or positive (
).
You should have also found that the value of
affects whether the graph lies above the
-axis (
) or below the
-axis (
).
These different properties are summarised in
[link] . The axes of symmetry for each graph is shown as a dashed line.
Table summarising general shapes and positions of functions of the form
. The axes of symmetry are shown as dashed lines.
Domain and range
For
, the function is undefined for
. The domain is therefore
.
We see that
can be re-written as:
This shows that the function is undefined at
. Therefore the range of
is
.
For example, the domain of
is
because
is undefined at
.
We see that
is undefined at
. Therefore the range is
.
Domain and range
Determine the range of
.
Given:
. Write down the domain of
.
Determine the domain of
Intercepts
For functions of the form,
, the intercepts with the
and
axis are calculated by setting
for the
-intercept and by setting
for the
-intercept.
The
-intercept is calculated as follows:
For example, the
-intercept of
is given by setting
to get:
The
-intercepts are calculated by setting
as follows:
For example, the
-intercept of
is given by setting
to get:
Intercepts
Given:
. Determine the coordinates of the intercepts of
with the x- and y-axes.
Determine the x-intercept of the graph of
. Give the reason why there is no y-intercept for this function.
Asymptotes
There are two asymptotes for functions of the form
. They are determined by examining the domain and range.
We saw that the function was undefined at
and for
. Therefore the asymptotes are
and
.
For example, the domain of
is
because
is undefined at
. We also see that
is undefined at
. Therefore the range is
.
From this we deduce that the asymptotes are at
and
.
Asymptotes
Given:
.Determine the equations of the asymptotes of
.
Write down the equation of the vertical asymptote of the graph
.
Sketching graphs of the form
In order to sketch graphs of functions of the form,
, we need to calculate four characteristics:
domain and range
asymptotes
-intercept
-intercept
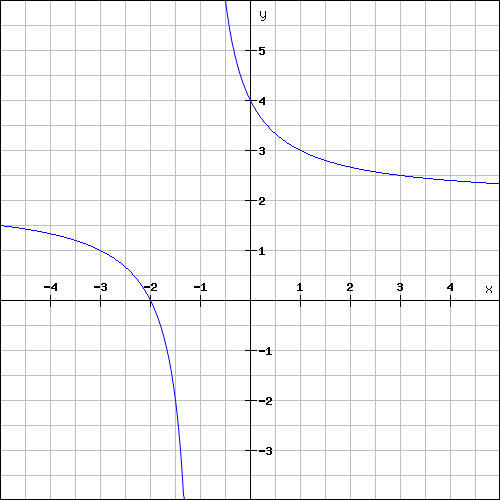
For example, sketch the graph of
. Mark the intercepts and asymptotes.
We have determined the domain to be
and the range to be
. Therefore the asymptotes are at
and
.
The
-intercept is
and the
-intercept is
.
Graph of
.
Graphs
Draw the graph of
. Indicate the horizontal asymptote.
Given:
. Sketch the graph of
showing clearly the asymptotes and ALL intercepts with the axes.
Draw the graph of
and
on the same system of axes.
Draw the graph of
. Explain your method.
Draw the graph of the function defined by
. Indicate the asymptotes and intercepts with the axes.
End of chapter exercises
Plot the graph of the hyperbola defined by
for
. Suppose the hyperbola is shifted 3 units to the right and 1 unit down. What is the new equation then ?
Based on the graph of
, determine the equation of the graph with asymptotes
and
and passing through the point (2; 3).