<< Chapter < Page Chapter >> Page >
This module contains a set of definitions from statistics that might be useful for advanced undergraduates.

Important definitions in statistics

It is not unusual for students to forget important concepts learned in an earlier course. This set of definitions is intended to stir memories of those wonderful times when you were learning statistics and econometrics. It is not intended to replace a statistics course but to provide you with a handy guide to the denfinition of some important terms in the statistical tools used by economists.

Random variables

Random experiment

A random experiment is an experiment whose outcome is uncertain.

Outcome space

The outcome space (also sometimes referred to as the sample space) is the list of all possible outcomes of a random experiment.

Single toss of a coin.

Consider the toss of a coin. Since the outcome is uncertain, tossing the coin is an example of a random experiment. The outcome space consists of a heads and a tails. If we let X be 0 if the outcome is a heads and let X equal 1 if the outcome is a tails, then X is a random variable. Since X only can take on integer values (0 or 1), it is a discrete random variable.

Random variable

A random variable is a number that can be assigned to an outcome of a random experiment. A discrete random variable has a finite number of possible values while a continuous random variable has an infinite number of potential values.

Non-stochastic variable

A non-stochastic variable is any variable that is not a random variable; i.e., does not represent the outcome of a random experiment.

Multiple tosses of a coin.

Let x equal the number of heads that occur when a coin is tossed n times. The tossing of the coin n times is a random experiment. The outcome space of this random experiment is an integar between 0 and n . Since the value x is equal represents the outcome of a random experiment, it is a random variable.

Random sample

A random sample of size n out of a population of size N has the characteristic that every member of the population is equally likely to be chosen.

Height of college age women.

Consider a random sample of the population of college age women. The height, x , of any woman chosen from this population is a random variable with a value somewhere in the outcome space, where the outcome space is a number between (say) 24 and 96 inches. Since in theory we can have as accurate a measurement as we might like, x can be thought of as being a continuous random variable.

Probability

General terms

Probability distribution for a discrete random variable.

Consider a discrete random variable x i MathType@MTEF@5@5@+=feaagyart1ev2aqatCvAUfeBSjuyZL2yd9gzLbvyNv2CaerbuLwBLnhiov2DGi1BTfMBaeXatLxBI9gBaerbd9wDYLwzYbItLDharqqtubsr4rNCHbGeaGqiVCI8FfYJH8YrFfeuY=Hhbbf9v8qqaqFr0xc9pk0xbba9q8WqFfeaY=biLkVcLq=JHqpepeea0=as0Fb9pgeaYRXxe9vr0=vr0=vqpWqaaeaabiGaciaacaqabeaadaqaaqaaaOqaaiaadIhadaWgaaWcbaGaamyAaaqabaaaaa@3800@ that represents an outcome of the n potential outcomes of a random experiment—that is, the set of potential outcomes is represented by X = ( x 1 , , x n ) . MathType@MTEF@5@5@+=feaagyart1ev2aqatCvAUfeBSjuyZL2yd9gzLbvyNv2CaerbuLwBLnhiov2DGi1BTfMBaeXatLxBI9gBaerbd9wDYLwzYbItLDharqqtubsr4rNCHbGeaGqiVCI8FfYJH8YrFfeuY=Hhbbf9v8qqaqFr0xc9pk0xbba9q8WqFfeaY=biLkVcLq=JHqpepeea0=as0Fb9pgeaYRXxe9vr0=vr0=vqpWqaaeaabiGaciaacaqabeaadaqaaqaaaOqaaiaahIfacqGH9aqpdaqadaqaaiaadIhadaWgaaWcbaGaaGymaaqabaGccaGGSaGaeSOjGSKaaiilaiaadIhadaWgaaWcbaGaamOBaaqabaaakiaawIcacaGLPaaacaGGUaaaaa@40A1@ Pr ( x i ) MathType@MTEF@5@5@+=feaagyart1ev2aqatCvAUfeBSjuyZL2yd9gzLbvyNv2CaerbuLwBLnhiov2DGi1BTfMBaeXatLxBI9gBaerbd9wDYLwzYbItLDharqqtubsr4rNCHbGeaGqiVCI8FfYJH8YrFfeuY=Hhbbf9v8qqaqFr0xc9pk0xbba9q8WqFfeaY=biLkVcLq=JHqpepeea0=as0Fb9pgeaYRXxe9vr0=vr0=vqpWqaaeaabiGaciaacaqabeaadaqaaqaaaOqaaiGaccfacaGGYbWaaeWaaeaacaWG4bWaaSbaaSqaaiaadMgaaeqaaaGccaGLOaGaayzkaaaaaa@3B5F@ Any function is a probability if and only if (1) Pr ( x i ) 0  for all  i = 1 , , n , MathType@MTEF@5@5@+=feaagyart1ev2aqatCvAUfeBSjuyZL2yd9gzLbvyNv2CaerbuLwBLnhiov2DGi1BTfMBaeXatLxBI9gBaerbd9wDYLwzYbItLDharqqtubsr4rNCHbGeaGqiVCI8FfYJH8YrFfeuY=Hhbbf9v8qqaqFr0xc9pk0xbba9q8WqFfeaY=biLkVcLq=JHqpepeea0=as0Fb9pgeaYRXxe9vr0=vr0=vqpWqaaeaabiGaciaacaqabeaadaqaaqaaaOqaaiGaccfacaGGYbWaaeWaaeaacaWG4bWaaSbaaSqaaiaadMgaaeqaaaGccaGLOaGaayzkaaGaeyyzImRaaGimaiaabccacaqGMbGaae4BaiaabkhacaqGGaGaaeyyaiaabYgacaqGSbGaaeiiaiaadMgacqGH9aqpcaaIXaGaaiilaiablAciljaacYcacaWGUbGaaiilaaaa@4C2E@ (2) Pr ( x i x j ) = Pr ( x i ) + Pr ( x j ) MathType@MTEF@5@5@+=feaagyart1ev2aqatCvAUfeBSjuyZL2yd9gzLbvyNv2CaerbuLwBLnhiov2DGi1BTfMBaeXatLxBI9gBaerbd9wDYLwzYbItLDharqqtubsr4rNCHbGeaGqiVCI8FfYJH8YrFfeuY=Hhbbf9v8qqaqFr0xc9pk0xbba9q8WqFfeaY=biLkVcLq=JHqpepeea0=as0Fb9pgeaYRXxe9vr0=vr0=vqpWqaaeaabiGaciaacaqabeaadaqaaqaaaOqaaiGaccfacaGGYbWaaeWaaeaacaWG4bWaaSbaaSqaaiaadMgaaeqaaOGaeyOkIGSaamiEamaaBaaaleaacaWGQbaabeaaaOGaayjkaiaawMcaaiabg2da9iGaccfacaGGYbWaaeWaaeaacaWG4bWaaSbaaSqaaiaadMgaaeqaaaGccaGLOaGaayzkaaGaey4kaSIaciiuaiaackhadaqadaqaaiaadIhadaWgaaWcbaGaamOAaaqabaaakiaawIcacaGLPaaaaaa@4BF6@ for all i and j, and (3) i = 1 n Pr ( x i ) = 1. MathType@MTEF@5@5@+=feaagyart1ev2aqatCvAUfeBSjuyZL2yd9gzLbvyNv2CaerbuLwBLnhiov2DGi1BTfMBaeXatLxBI9gBaerbd9wDYLwzYbItLDharqqtubsr4rNCHbGeaGqiVCI8FfYJH8YrFfeuY=Hhbbf9v8qqaqFr0xc9pk0xbba9q8WqFfeaY=biLkVcLq=JHqpepeea0=as0Fb9pgeaYRXxe9vr0=vr0=vqpWqaaeaabiGaciaacaqabeaadaqaaqaaaOqaamaaqahabaGaciiuaiaackhadaqadaqaaiaadIhadaWgaaWcbaGaamyAaaqabaaakiaawIcacaGLPaaaaSqaaiaadMgacqGH9aqpcaaIXaaabaGaamOBaaqdcqGHris5aOGaeyypa0JaaGymaiaac6caaaa@43C0@ An example of a discrete distribution is in Example 4.

Discrete distribution.

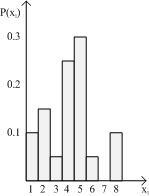
Figure 1 illustrates a discrete probability distribution where x i MathType@MTEF@5@5@+=feaagyart1ev2aqatCvAUfeBSjuyZL2yd9gzLbvyNv2CaerbuLwBLnhiov2DGi1BTfMBaeXatLxBI9gBaerbd9wDYLwzYbItLDharqqtubsr4rNCHbGeaGqiVCI8FfYJH8YrFfeuY=Hhbbf9v8qqaqFr0xc9pk0xbba9q8WqFfeaY=biLkVcLq=JHqpepeea0=as0Fb9pgeaYRXxe9vr0=vr0=vqpWqaaeaabiGaciaacaqabeaadaqaaqaaaOqaaiaadIhadaWgaaWcbaGaamyAaaqabaaaaa@3800@ goes from 1 to 8. The areas in the shaded rectangles sum to 1.

A discrete probability function

Graph of a discrete probability function.
The areas of the rectangles sum to 1.

Questions & Answers

Ayele, K., 2003. Introductory Economics, 3rd ed., Addis Ababa.
Widad Reply
can you send the book attached ?
Ariel
?
Ariel
What is economics
Widad Reply
the study of how humans make choices under conditions of scarcity
AI-Robot
U(x,y) = (x×y)1/2 find mu of x for y
Desalegn Reply
U(x,y) = (x×y)1/2 find mu of x for y
Desalegn
what is ecnomics
Jan Reply
this is the study of how the society manages it's scarce resources
Belonwu
what is macroeconomic
John Reply
macroeconomic is the branch of economics which studies actions, scale, activities and behaviour of the aggregate economy as a whole.
husaini
etc
husaini
difference between firm and industry
husaini Reply
what's the difference between a firm and an industry
Abdul
firm is the unit which transform inputs to output where as industry contain combination of firms with similar production 😅😅
Abdulraufu
Suppose the demand function that a firm faces shifted from Qd  120 3P to Qd  90  3P and the supply function has shifted from QS  20  2P to QS 10  2P . a) Find the effect of this change on price and quantity. b) Which of the changes in demand and supply is higher?
Toofiq Reply
explain standard reason why economic is a science
innocent Reply
factors influencing supply
Petrus Reply
what is economic.
Milan Reply
scares means__________________ends resources. unlimited
Jan
economics is a science that studies human behaviour as a relationship b/w ends and scares means which have alternative uses
Jan
calculate the profit maximizing for demand and supply
Zarshad Reply
Why qualify 28 supplies
Milan
what are explicit costs
Nomsa Reply
out-of-pocket costs for a firm, for example, payments for wages and salaries, rent, or materials
AI-Robot
concepts of supply in microeconomics
David Reply
economic overview notes
Amahle Reply
identify a demand and a supply curve
Salome Reply
i don't know
Parul
there's a difference
Aryan
Demand curve shows that how supply and others conditions affect on demand of a particular thing and what percent demand increase whith increase of supply of goods
Israr
Hi Sir please how do u calculate Cross elastic demand and income elastic demand?
Abari
Got questions? Join the online conversation and get instant answers!
Jobilize.com Reply

Get Jobilize Job Search Mobile App in your pocket Now!

Get it on Google Play Download on the App Store Now


Source:  OpenStax, Econometrics for honors students. OpenStax CNX. Jul 20, 2010 Download for free at http://cnx.org/content/col11208/1.2
Google Play and the Google Play logo are trademarks of Google Inc.

Notification Switch

Would you like to follow the 'Econometrics for honors students' conversation and receive update notifications?

Ask