Up to now, in this chapter, we have graphed lines by plotting points, by using intercepts, and by recognizing horizontal and vertical lines.
One other method we can use to graph lines is called the
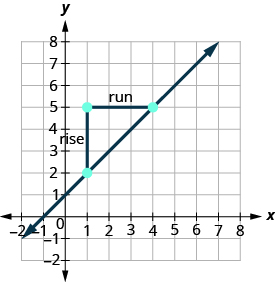
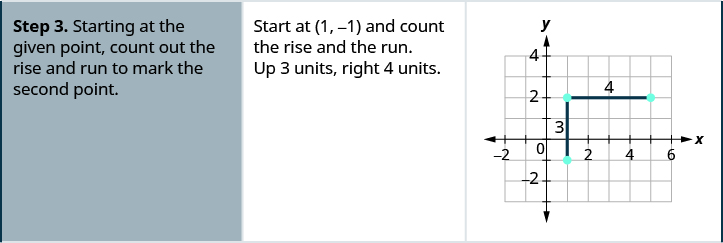
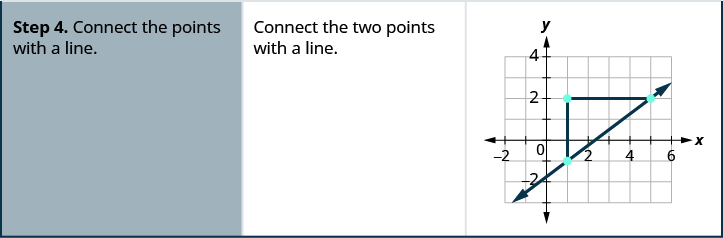
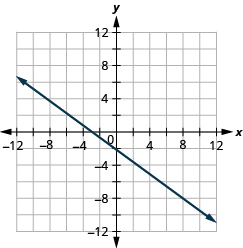
point–slope method . We will use this method when we know one point and the slope of the line. We will start by plotting the point and then use the definition of slope to draw the graph of the line.
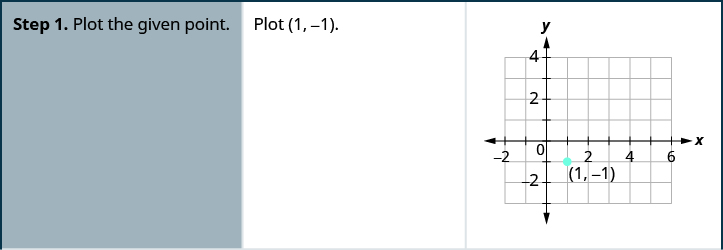
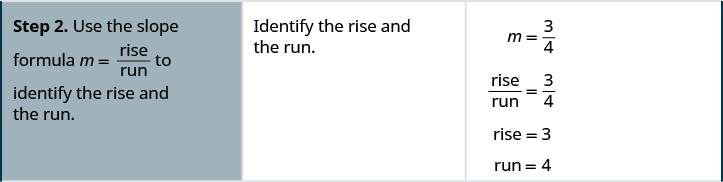
How to graph a line given a point and the slope
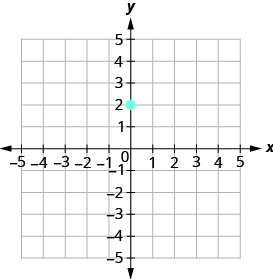
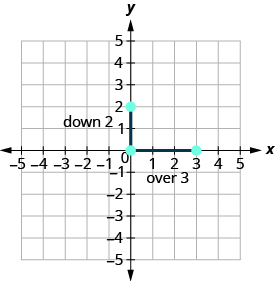
Graph the line passing through the point
whose slope is
.
the study of living organisms and their interactions with one another and their environment.
Wine
discuss the biological phenomenon and provide pieces of evidence to show that it was responsible for the formation of eukaryotic organelles in an essay form
advantage of electronic microscope is easily and clearly while disadvantage is dangerous because its electronic. advantage of light microscope is savely and naturally by sun while disadvantage is not easily,means its not sharp and not clear
Abdullahi
cell theory state that every organisms composed of one or more cell,cell is the basic unit of life
Abdullahi
is like gone fail us
DENG
cells is the basic structure and functions of all living things
A scanning electron microscope (SEM) is ideal for situations requiring high-resolution imaging of surfaces. It is commonly used in materials science, biology, and geology to examine the topography and composition of samples at a nanoscale level. SEM is particularly useful for studying fine details,
Hilary
Got questions? Join the online conversation and get instant answers!