<< Chapter < Page Chapter >> Page >
This module is from Elementary Algebra by Denny Burzynski and Wade Ellis, Jr. In this chapter the student is shown how graphs provide information that is not always evident from the equation alone. The chapter begins by establishing the relationship between the variables in an equation, the number of coordinate axes necessary to construct its graph, and the spatial dimension of both the coordinate system and the graph. Interpretation of graphs is also emphasized throughout the chapter, beginning with the plotting of points. The slope formula is fully developed, progressing from verbal phrases to mathematical expressions. The expressions are then formed into an equation by explicitly stating that a ratio is a comparison of two quantities of the same type (e.g., distance, weight, or money). This approach benefits students who take future courses that use graphs to display information.The student is shown how to graph lines using the intercept method, the table method, and the slope-intercept method, as well as how to distinguish, by inspection, oblique and horizontal/vertical lines. Objectives of this module: be able to relate solutions to a linear equation to lines, know the general form of a linear equation, be able to construct the graph of a line using the intercept method, be able to distinguish, by their equations, slanted, horizontal, and vertical lines.

Overview

  • Solutions and Lines
  • General form of a Linear Equation
  • The Intercept Method of Graphing
  • Graphing Using any Two or More Points
  • Slanted, Horizontal, and Vertical Lines

Solutions and lines

We know that solutions to linear equations in two variables can be expressed as ordered pairs. Hence, the solutions can be represented by point in the plane. We also know that the phrase “graph the equation” means to locate the solution to the given equation in the plane. Consider the equation y 2 x = 3 . We’ll graph six solutions (ordered pairs) to this equation on the coordinates system below. We’ll find the solutions by choosing x -values (from 1 to + 4 ), substituting them into the equation y 2 x = 3 , and then solving to obtain the corresponding y -values . We can keep track of the ordered pairs by using a table.

y 2 x = 3

If x = Then y = Ordered Pairs
1 5 ( 1 , 5 )
0 3 ( 0 , 3 )
1 1 ( 1 , 1 )
2 1 ( 2 , 1 )
3 3 ( 3 , 3 )
4 5 ( 4 , 5 )

Total six points plotted for graphing the line y minus two x equals negative three. The coordinates of these points are negative one, negative five; zero, negative three; one, negative one; two, one; three, three; and four, five.

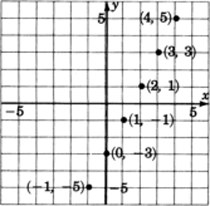
We have plotted only six solutions to the equation y 2 x = 3 
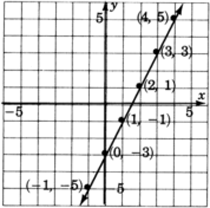
. There are, as we know, infinitely many solutions. By observing the six points we have plotted, we can speculate as to the location of all the other points. The six points we plotted seem to lie on a straight line. This would lead us to believe that all the other points (solutions) also lie on that same line. Indeed, this is true. In fact, this is precisely why first-degree equations are called linear equations.

Linear equations produce straight lines

Line Linear

A graph of a line passing through six points with the coordinates negative one, negative five; zero, negative three; one, negative one; two, one; three, three; and four, five.

General form of a linear equation

General form of a linear equation in two variables

There is a standard form in which linear equations in two variables are written. Suppose that a , b , and c are any real numbers and that a and b cannot both be zero at the same time. Then, the linear equation in two variables

Questions & Answers

how do you get the 2/50
Abba Reply
number of sport play by 50 student construct discrete data
Aminu Reply
width of the frangebany leaves on how to write a introduction
Theresa Reply
Solve the mean of variance
Veronica Reply
Step 1: Find the mean. To find the mean, add up all the scores, then divide them by the number of scores. ... Step 2: Find each score's deviation from the mean. ... Step 3: Square each deviation from the mean. ... Step 4: Find the sum of squares. ... Step 5: Divide the sum of squares by n – 1 or N.
kenneth
what is error
Yakuba Reply
Is mistake done to something
Vutshila
Hy
anas
hy
What is the life teble
anas
hy
Jibrin
statistics is the analyzing of data
Tajudeen Reply
what is statics?
Zelalem Reply
how do you calculate mean
Gloria Reply
diveving the sum if all values
Shaynaynay
let A1,A2 and A3 events be independent,show that (A1)^c, (A2)^c and (A3)^c are independent?
Fisaye Reply
what is statistics
Akhisani Reply
data collected all over the world
Shaynaynay
construct a less than and more than table
Imad Reply
The sample of 16 students is taken. The average age in the sample was 22 years with astandard deviation of 6 years. Construct a 95% confidence interval for the age of the population.
Aschalew Reply
Bhartdarshan' is an internet-based travel agency wherein customer can see videos of the cities they plant to visit. The number of hits daily is a normally distributed random variable with a mean of 10,000 and a standard deviation of 2,400 a. what is the probability of getting more than 12,000 hits? b. what is the probability of getting fewer than 9,000 hits?
Akshay Reply
Bhartdarshan'is an internet-based travel agency wherein customer can see videos of the cities they plan to visit. The number of hits daily is a normally distributed random variable with a mean of 10,000 and a standard deviation of 2,400. a. What is the probability of getting more than 12,000 hits
Akshay
1
Bright
Sorry i want to learn more about this question
Bright
Someone help
Bright
a= 0.20233 b=0.3384
Sufiyan
a
Shaynaynay
How do I interpret level of significance?
Mohd Reply
It depends on your business problem or in Machine Learning you could use ROC- AUC cruve to decide the threshold value
Shivam
how skewness and kurtosis are used in statistics
Owen Reply
yes what is it
Taneeya
Got questions? Join the online conversation and get instant answers!
Jobilize.com Reply

Get Jobilize Job Search Mobile App in your pocket Now!

Get it on Google Play Download on the App Store Now


Source:  OpenStax, Elementary algebra. OpenStax CNX. May 08, 2009 Download for free at http://cnx.org/content/col10614/1.3
Google Play and the Google Play logo are trademarks of Google Inc.

Notification Switch

Would you like to follow the 'Elementary algebra' conversation and receive update notifications?

Ask