<< Chapter < Page
  From matlab and simulink to real     Page 1 / 3
Chapter >> Page >
The Least Mean Squares (LMS) Algorithm can be used in a range of Digital Signal Processing applications such as echo cancellation and acoustic noise reduction. This laboratory shows how to design a model of LMS Noise Cancellation using Simulink and run it on a Texas Instruments C6000 DSP.

Introduction

The Least Mean Squares (LMS) Algorithm can be used in a range of Digital Signal Processing applications such as echo cancellation and acoustic noise reduction.

This laboratory shows how to design a model of LMS Noise Cancellation using Simulink and run it on a Texas Instruments C6000 DSP.

Objectives

  • Design a model of LMS Noise Reduction for the Texas Instruments C6000 family of DSP devices using MATLAB® and Simulink®.
  • Modify an existing Simulink demonstration model for use as a template.
  • Run the project on the Texas Instruments DSK6713 with a microphone and computer loudspeakers / headphones.

Level

Intermediate - Assumes prior knowledge of MATLAB and Simulink. It also requires a theoretical understanding of matrices and the LMS algorithm.

Hardware and software requirements

This laboratory was originally developed using the following hardware and software:

  • MATLAB R2006b with Embedded Target for TI C6000 and the Signal Processing Toolbox.
  • Code Composer Studio (CCS) v3.1
  • Texas Instruments DSK6713 hardware.
  • Microphone and computer loudspeakers / headphones.

Simulation

You will now start with a simple Simulink model and run it to see how it works.

Opening the acoustic noise cancellation model

Open the AcousticNoiseCancellation.mdl
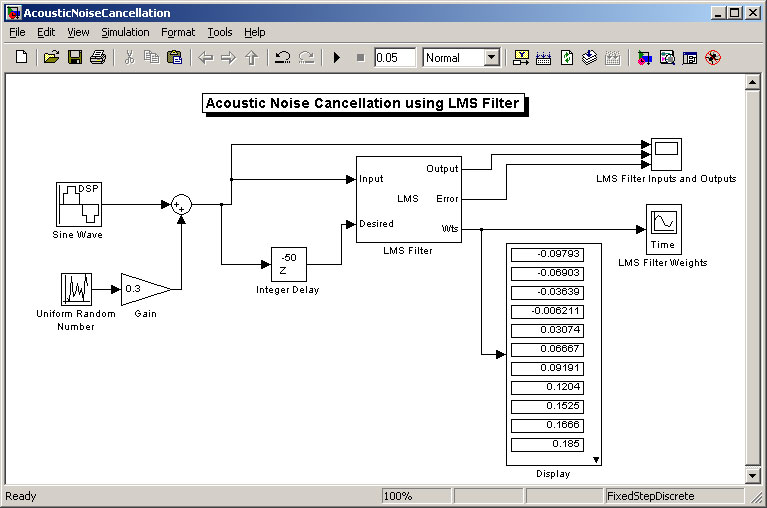
Opening the AcousticNoiseCancellation Model

Run the model.

Inputs and outputs of lms filter

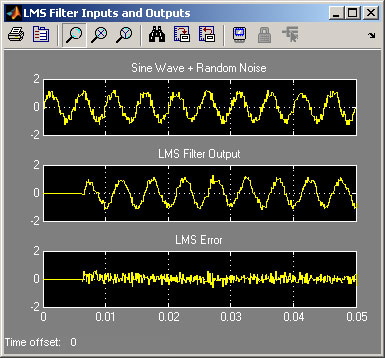
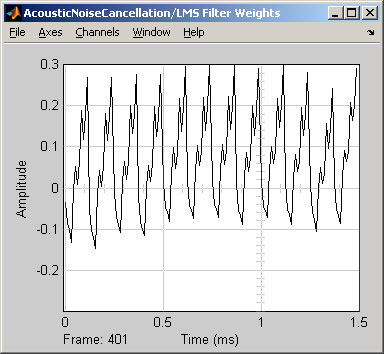
The output from the LMS Filter starts at zero and grows slowly. Initially, some of the sine wave information is lost as LMS Error.

LMS Filter Inputs and Outputs

Lms filter weights (coefficients)

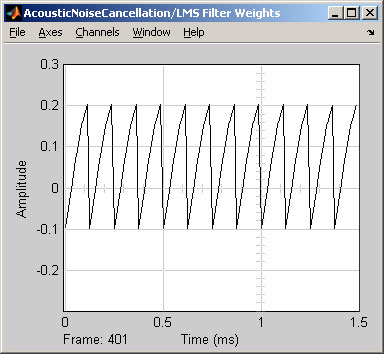
The LMS Filter Weights all start at zero and take several iterations to reach their final values.

LMS Filter Weights (Coefficients)

Tuning the model

The critical variable in the LMS Filter is the “Step size (mu)”. This sets the rate of convergence of the LMS filter.

Changing the Step size (mu) to 0.1

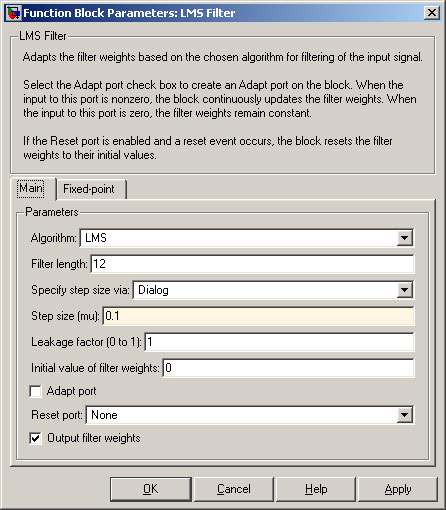
Double-click on the “LMS Filter” block and change the “Step size (mu) to 0.1

Run the model.

Filter outputs for step size (mu) = 0.1

When the “Step size (mu)” is increased, LMS algorithm converges more quickly, but at the expense of granularity – the LMS Filter Output is not as smooth.

Input and LMS Filter Outputs for Step size (mu) = 0.1

Filter weights for step size (mu) = 0.1

Note that the filter weights (coefficients) do not attain smooth values, as would be the case for smaller values of Step size (mu).

LMS Filter Weights for Step size (mu) = 0.1

Changing the delay

Part of the Acoustic Noise Algorithm is the delay. The delay should ideally be at least half a wavelength so the two inputs to the LMS Filter have different random noise.

Questions & Answers

differentiate between demand and supply giving examples
Lambiv Reply
differentiated between demand and supply using examples
Lambiv
what is labour ?
Lambiv
how will I do?
Venny Reply
how is the graph works?I don't fully understand
Rezat Reply
information
Eliyee
devaluation
Eliyee
t
WARKISA
hi guys good evening to all
Lambiv
multiple choice question
Aster Reply
appreciation
Eliyee
explain perfect market
Lindiwe Reply
In economics, a perfect market refers to a theoretical construct where all participants have perfect information, goods are homogenous, there are no barriers to entry or exit, and prices are determined solely by supply and demand. It's an idealized model used for analysis,
Ezea
What is ceteris paribus?
Shukri Reply
other things being equal
AI-Robot
When MP₁ becomes negative, TP start to decline. Extuples Suppose that the short-run production function of certain cut-flower firm is given by: Q=4KL-0.6K2 - 0.112 • Where is quantity of cut flower produced, I is labour input and K is fixed capital input (K-5). Determine the average product of lab
Kelo
Extuples Suppose that the short-run production function of certain cut-flower firm is given by: Q=4KL-0.6K2 - 0.112 • Where is quantity of cut flower produced, I is labour input and K is fixed capital input (K-5). Determine the average product of labour (APL) and marginal product of labour (MPL)
Kelo
yes,thank you
Shukri
Can I ask you other question?
Shukri
what is monopoly mean?
Habtamu Reply
What is different between quantity demand and demand?
Shukri Reply
Quantity demanded refers to the specific amount of a good or service that consumers are willing and able to purchase at a give price and within a specific time period. Demand, on the other hand, is a broader concept that encompasses the entire relationship between price and quantity demanded
Ezea
ok
Shukri
how do you save a country economic situation when it's falling apart
Lilia Reply
what is the difference between economic growth and development
Fiker Reply
Economic growth as an increase in the production and consumption of goods and services within an economy.but Economic development as a broader concept that encompasses not only economic growth but also social & human well being.
Shukri
production function means
Jabir
What do you think is more important to focus on when considering inequality ?
Abdisa Reply
any question about economics?
Awais Reply
sir...I just want to ask one question... Define the term contract curve? if you are free please help me to find this answer 🙏
Asui
it is a curve that we get after connecting the pareto optimal combinations of two consumers after their mutually beneficial trade offs
Awais
thank you so much 👍 sir
Asui
In economics, the contract curve refers to the set of points in an Edgeworth box diagram where both parties involved in a trade cannot be made better off without making one of them worse off. It represents the Pareto efficient allocations of goods between two individuals or entities, where neither p
Cornelius
In economics, the contract curve refers to the set of points in an Edgeworth box diagram where both parties involved in a trade cannot be made better off without making one of them worse off. It represents the Pareto efficient allocations of goods between two individuals or entities,
Cornelius
Suppose a consumer consuming two commodities X and Y has The following utility function u=X0.4 Y0.6. If the price of the X and Y are 2 and 3 respectively and income Constraint is birr 50. A,Calculate quantities of x and y which maximize utility. B,Calculate value of Lagrange multiplier. C,Calculate quantities of X and Y consumed with a given price. D,alculate optimum level of output .
Feyisa Reply
Answer
Feyisa
c
Jabir
the market for lemon has 10 potential consumers, each having an individual demand curve p=101-10Qi, where p is price in dollar's per cup and Qi is the number of cups demanded per week by the i th consumer.Find the market demand curve using algebra. Draw an individual demand curve and the market dema
Gsbwnw Reply
suppose the production function is given by ( L, K)=L¼K¾.assuming capital is fixed find APL and MPL. consider the following short run production function:Q=6L²-0.4L³ a) find the value of L that maximizes output b)find the value of L that maximizes marginal product
Abdureman
types of unemployment
Yomi Reply
What is the difference between perfect competition and monopolistic competition?
Mohammed
Got questions? Join the online conversation and get instant answers!
Jobilize.com Reply

Get Jobilize Job Search Mobile App in your pocket Now!

Get it on Google Play Download on the App Store Now


Source:  OpenStax, From matlab and simulink to real-time with ti dsp's. OpenStax CNX. Jun 08, 2009 Download for free at http://cnx.org/content/col10713/1.1
Google Play and the Google Play logo are trademarks of Google Inc.

Notification Switch

Would you like to follow the 'From matlab and simulink to real-time with ti dsp's' conversation and receive update notifications?

Ask