

| << Chapter < Page | Chapter >> Page > |
Method: Calculating the percentiles
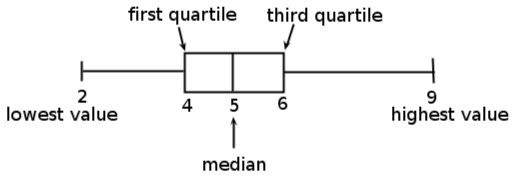
We can summarise a data set by using the five number summary. The five number summary gives the lowest data value, the highest data value, the median, the first (lower) quartile and the third (higher) quartile. Consider the following set of data: 5, 3, 4, 6, 2, 8, 5, 4, 6, 7, 3, 6, 9, 4, 5. We first order the data as follows: 2, 3, 3, 4, 4, 4, 5, 5, 5, 6, 6, 6, 7, 8, 9. The lowest data value is 2 and the highest data value is 9. The median is 5. The first quartile is 4 and the third quartile is 6. So the five number summary is: 2, 4, 5, 6, 9.
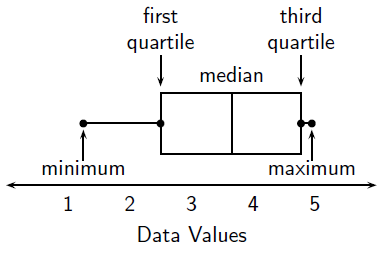
The five number summary can be shown graphically in a box and whisker plot. The main features of the box and whisker diagram are shown in [link] . The box can lie horizontally (as shown) or vertically. For a horizonatal diagram, the left edge of the box is placed at the first quartile and the right edge of the box is placed at the third quartile. The height ofthe box is arbitrary, as there is no y-axis. Inside the box there is some representation of central tendency, with the median shown with a vertical line dividing the box into two. Additionally, astar or asterix is placed at the mean value, centered in the box in the vertical direction. The whiskers which extend to the sides reach the minimum and maximum values. This is shown for the data set: 5, 3, 4, 6, 2, 8, 5, 4, 6, 7, 3, 6, 9, 4, 5.
Draw a box and whisker diagram for the data set: .
We can apply the concepts of mean, median and mode to data that has been grouped. Grouped data does not have individual data points, but rather has the data organized into groups or bins. To calculate the mean we need to add up all the frequencies and divide by the total. We do not know what the actual data values are, so we approximate by choosing the midpoint of each group. We then multiply those midpoint numbers by the frequency. Then we add these numbers together to find the approximate total of the masses. The modal group is the group with the highest frequency. The median group is the group that contains the middle terms.
Measures of dispersion can also be found for grouped data. The range is found by subtracting the smallest number in the lowest bin from the largest number in the highest bin. The quartiles are found in a similar way to the median.
Consider the following grouped data and calculate the mean, the modal group and the median group.
| Mass (kg) | Frequency |
| 41 - 45 | 7 |
| 46 - 50 | 10 |
| 51 - 55 | 15 |
| 56 - 60 | 12 |
| 61 - 65 | 6 |
| Total = 50 |
To calculate the mean we need to add up all the masses and divide by 50. We do not know actual masses, so we approximate by choosing the midpoint of each group. We then multiply those midpoint numbers by the frequency. Then we add these numbers together to find the approximate total of the masses. This is show in the table below.
| Mass (kg) | Midpoint | Frequency | Midpt Freq |
| 41 - 45 | (41+45)/2 = 43 | 7 | 43 7 = 301 |
| 46 - 50 | 48 | 10 | 480 |
| 51 - 55 | 53 | 15 | 795 |
| 56 - 60 | 58 | 12 | 696 |
| 61 - 65 | 63 | 6 | 378 |
| Total = 50 | Total = 2650 |
The mean = .
The modal group is the group 51 - 53 because it has the highest frequency.
The median group is the group 51 - 53, since the 25th and 26th terms are contained within this group.
In each data set given, find the mean, the modal group and the median group.
| Time in seconds | Frequency |
| 36 - 45 | 5 |
| 46 - 55 | 11 |
| 56 - 65 | 15 |
| 66 - 75 | 26 |
| 76 - 85 | 19 |
| 86 - 95 | 13 |
| 96 - 105 | 6 |
| Mass in kilograms | Frequency |
| 41 - 45 | 3 |
| 46 - 50 | 5 |
| 51 - 55 | 8 |
| 56 - 60 | 12 |
| 61 - 65 | 14 |
| 66 - 70 | 9 |
| 71 - 75 | 7 |
| 76 - 80 | 2 |
Notification Switch
Would you like to follow the 'Siyavula textbooks: grade 10 maths [caps]' conversation and receive update notifications?

|
|

|
|

|
|

|
|

|
|

|
|

|
|

|
|
|
|
|

|