This module is from Elementary Algebra by Denny Burzynski and Wade Ellis, Jr.
In this chapter the student is shown how graphs provide information that is not always evident from the equation alone. The chapter begins by establishing the relationship between the variables in an equation, the number of coordinate axes necessary to construct its graph, and the spatial dimension of both the coordinate system and the graph. Interpretation of graphs is also emphasized throughout the chapter, beginning with the plotting of points. The slope formula is fully developed, progressing from verbal phrases to mathematical expressions. The expressions are then formed into an equation by explicitly stating that a ratio is a comparison of two quantities of the same type (e.g., distance, weight, or money). This approach benefits students who take future courses that use graphs to display information.The student is shown how to graph lines using the intercept method, the table method, and the slope-intercept method, as well as how to distinguish, by inspection, oblique and horizontal/vertical lines.
Objectives of this module: be able to locate solutions to linear inequalities in two variables using graphical techniques.
Overview
- Location of Solutions
- Method of Graphing
Location of solutions
In our study of linear equations in two variables, we observed that
all the solutions to the equation, and only the solutions to the equation, were located on the graph of the equation. We now wish to determine the location of the solutions to linear inequalities in two variables. Linear inequalities in two variables are inequalities of the forms:
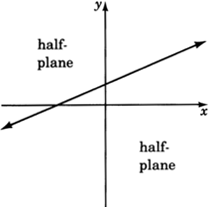
Half-planes
A straight line drawn through the plane divides the plane into two
half-planes .
Boundary line
The straight line is called the
boundary line .
Solution to an inequality in two variables
Recall that when working with linear equations in two variables, we observed that ordered pairs that produced true statements when substituted into an equation were called solutions to that equation. We can make a similar statement for inequalities in two variables. We say that an inequality in two variables has a solution when a pair of values has been found such that when these values are substituted into the inequality a true statement results.
The location of solutions in the plane
As with equations, solutions to linear inequalities have particular locations in the plane. All solutions to a linear inequality in two variables are located in one and only in one entire half-plane. For example, consider the inequality
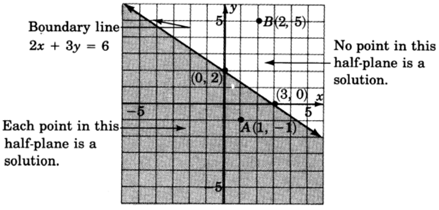
All the solutions to the inequality
lie in the shaded half-plane.
Method of graphing
The method of graphing linear inequalities in two variables is as follows:
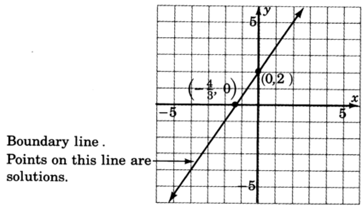
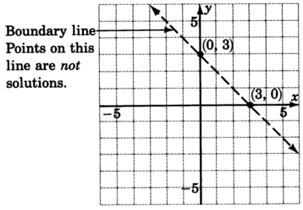
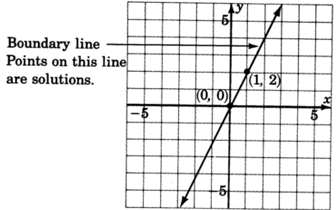
- Graph the boundary line (consider the inequality as an equation, that is, replace the inequality sign with an equal sign).
- If the inequality is
or
, draw the boundary line
solid . This means that points on the line are solutions and are part of the graph.
- If the inequality is
or
, draw the boundary line
dotted . This means that points on the line are
not solutions and are
not part of the graph.
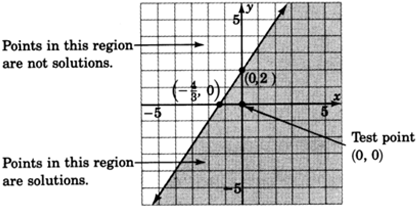
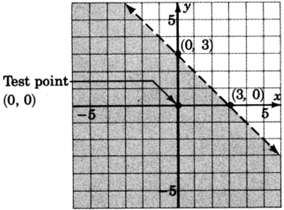
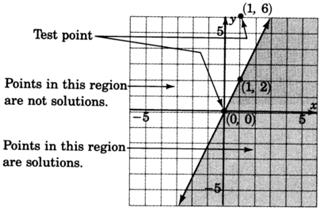
- Determine which half-plane to shade by choosing a test point.
- If, when substituted, the test point yields a true statement, shade the half-plane containing it.
- If, when substituted, the test point yields a false statement, shade the half-plane on the opposite side of the boundary line.
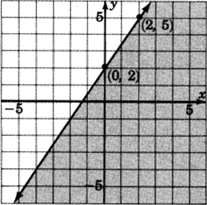
Sample set a
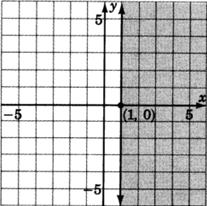
Graph
.
1. Graph the boundary line. The inequality is
so we’ll draw the line
solid . Consider the inequality as an equation.
|
|
|
|
|
|
|
|
2. Choose a test point. The easiest one is
. Substitute
into the original inequality.
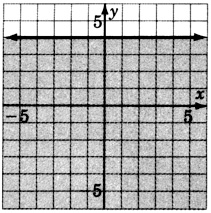
Shade the half-plane containing
.
 Got questions? Get instant answers now!
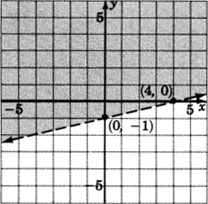
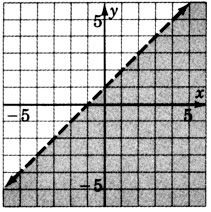
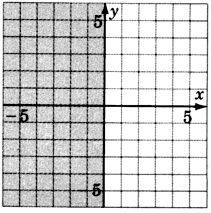
Graph
.
1. Graph the boundary line:
. The inequality is
so we’ll draw the line
dotted .
2. Choose a test point, say
.
Shade the half-plane containing
.
 Got questions? Get instant answers now!
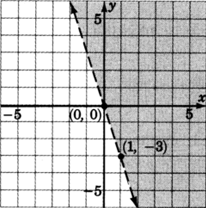
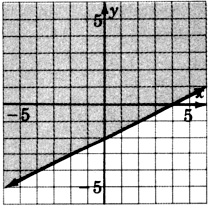
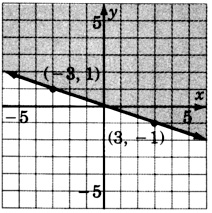
Graph
.
- Graph the boundary line
. The inequality is
, so we’ll draw the line
solid .
- Choose a test point, say
.
Shade the half-plane containing
. We can’t!
is right on the line! Pick another test point, say
.
Shade the half-plane on the opposite side of the boundary line.
Got questions? Get instant answers now!
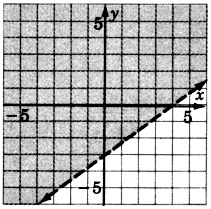
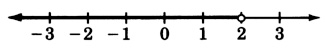
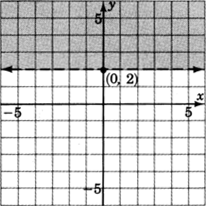
Graph
.
1. Graph the boundary line
. The inequality is
so we’ll draw the line
dotted .
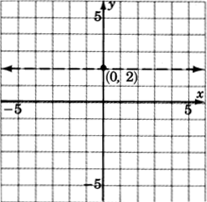
2. We don’t really need a test point. Where is
Above the line
Any point above the line clearly has a
greater than 2.
Got questions? Get instant answers now!
Practice set a
Solve the following inequalities by graphing.
Exercises
Solve the inequalities by graphing.
Exercises for review