

| << Chapter < Page | Chapter >> Page > |
By the end of this section, you will be able to:
When examining economic statistics, there is a crucial distinction worth emphasizing. The distinction is between nominal and real measurements, which refer to whether or not inflation has distorted a given statistic. Looking at economic statistics without considering inflation is like looking through a pair of binoculars and trying to guess how close something is: unless you know how strong the lenses are, you cannot guess the distance very accurately. Similarly, if you do not know the rate of inflation, it is difficult to figure out if a rise in GDP is due mainly to a rise in the overall level of prices or to a rise in quantities of goods produced. The nominal value of any economic statistic means the statistic is measured in terms of actual prices that exist at the time. The real value refers to the same statistic after it has been adjusted for inflation. Generally, it is the real value that is more important.
[link] shows U.S. GDP at five-year intervals since 1960 in nominal dollars; that is, GDP measured using the actual market prices prevailing in each stated year. This data is also reflected in the graph shown in [link]
| Year | Nominal GDP (billions of dollars) | GDP Deflator (2005 = 100) |
|---|---|---|
| 1960 | 543.3 | 19.0 |
| 1965 | 743.7 | 20.3 |
| 1970 | 1,075.9 | 24.8 |
| 1975 | 1,688.9 | 34.1 |
| 1980 | 2,862.5 | 48.3 |
| 1985 | 4,346.7 | 62.3 |
| 1990 | 5,979.6 | 72.7 |
| 1995 | 7,664.0 | 81.7 |
| 2000 | 10,289.7 | 89.0 |
| 2005 | 13,095.4 | 100.0 |
| 2010 | 14,958.3 | 110.0 |
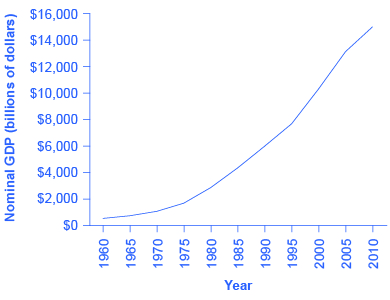
If an unwary analyst compared nominal GDP in 1960 to nominal GDP in 2010, it might appear that national output had risen by a factor of twenty-seven over this time (that is, GDP of $14,958 billion in 2010 divided by GDP of $543 billion in 1960). This conclusion would be highly misleading. Recall that nominal GDP is defined as the quantity of every good or service produced multiplied by the price at which it was sold, summed up for all goods and services. In order to see how much production has actually increased, we need to extract the effects of higher prices on nominal GDP. This can be easily done, using the GDP deflator.
GDP deflator is a price index measuring the average prices of all goods and services included in the economy. We explore price indices in detail and how they are computed in Inflation , but this definition will do in the context of this chapter. The data for the GDP deflator are given in [link] and shown graphically in [link] .
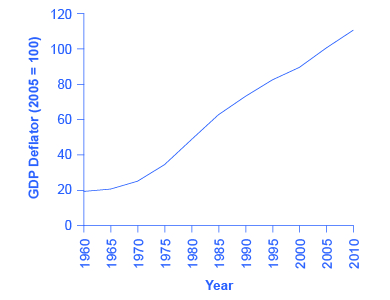
[link] shows that the price level has risen dramatically since 1960. The price level in 2010 was almost six times higher than in 1960 (the deflator for 2010 was 110 versus a level of 19 in 1960). Clearly, much of the apparent growth in nominal GDP was due to inflation, not an actual change in the quantity of goods and services produced, in other words, not in real GDP. Recall that nominal GDP can rise for two reasons: an increase in output, and/or an increase in prices. What is needed is to extract the increase in prices from nominal GDP so as to measure only changes in output. After all, the dollars used to measure nominal GDP in 1960 are worth more than the inflated dollars of 1990—and the price index tells exactly how much more. This adjustment is easy to do if you understand that nominal measurements are in value terms, where
Notification Switch
Would you like to follow the 'Principles of economics' conversation and receive update notifications?

|
|

|
|
|
|
|

|
|

|
|

|
|

|
|

|
|

|
|

|
|

|