Functions of the form
are known as
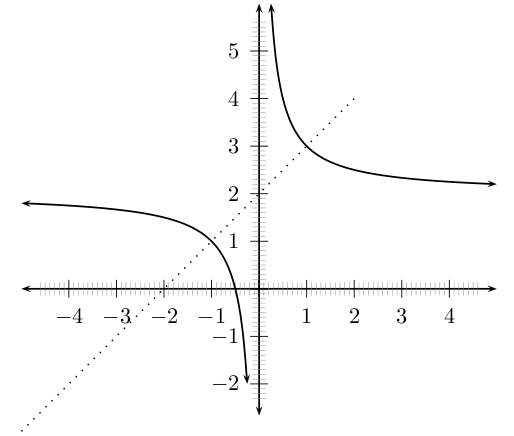
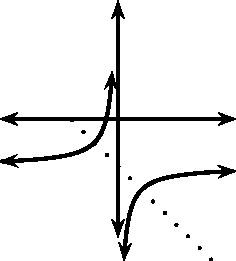
hyperbolic functions. The general form of the graph of this function is shown in
[link] .
General shape and position of the graph of a function of the form
.
Investigation : functions of the form
On the same set of axes, plot the following graphs:
Use your results to deduce the effect of
.
On the same set of axes, plot the following graphs:
Use your results to deduce the effect of
.
You should have found that the value of
affects whether the graph is located in the first and third quadrants of Cartesian plane.
You should have also found that the value of
affects whether the graph lies above the
-axis (
) or below the
-axis (
).
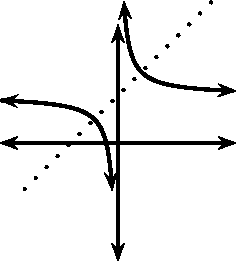
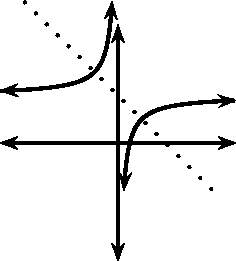
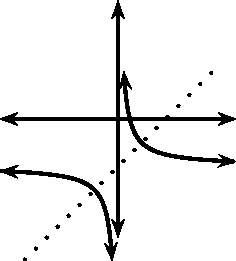
These different properties are summarised in
[link] . The axes of symmetry for each graph are shown as a dashed line.
Table summarising general shapes and positions of functions of the form
. The axes of symmetry are shown as dashed lines.
Domain and range
For
, the function is undefined for
. The domain is therefore
.
We see that
can be re-written as:
This shows that the function is undefined at
. Therefore the range of
is
.
For example, the domain of
is
because
is undefined at
.
We see that
is undefined at
. Therefore the range is
.
Intercepts
For functions of the form,
, the intercepts with the
and
axis is calculated by setting
for the
-intercept and by setting
for the
-intercept.
The
-intercept is calculated as follows:
which is undefined because we are dividing by 0. Therefore there is no
-intercept.
For example, the
-intercept of
is given by setting
to get:
which is undefined.
The
-intercepts are calculated by setting
as follows:
For example, the
-intercept of
is given by setting
to get:
Asymptotes
There are two asymptotes for functions of the form
. Just a reminder, an asymptote is a straight or curved line, which the graph of a function will approach, but never touch. They are determined by examining the domain and range.
We saw that the function was undefined at
and for
. Therefore the asymptotes are
and
.
For example, the domain of
is
because
is undefined at
. We also see that
is undefined at
. Therefore the range is
.
From this we deduce that the asymptotes are at
and
.
Sketching graphs of the form
In order to sketch graphs of functions of the form,
, we need to determine four characteristics:
domain and range
asymptotes
-intercept
-intercept
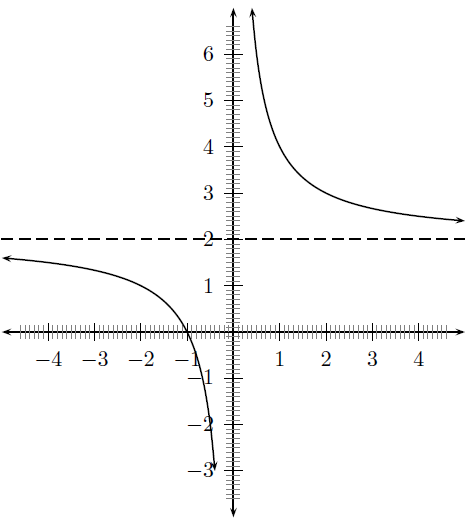
For example, sketch the graph of
. Mark the intercepts and asymptotes.
We have determined the domain to be
and the range to be
. Therefore the asymptotes are at
and
.
There is no
-intercept and the
-intercept is
.
Graph of
.
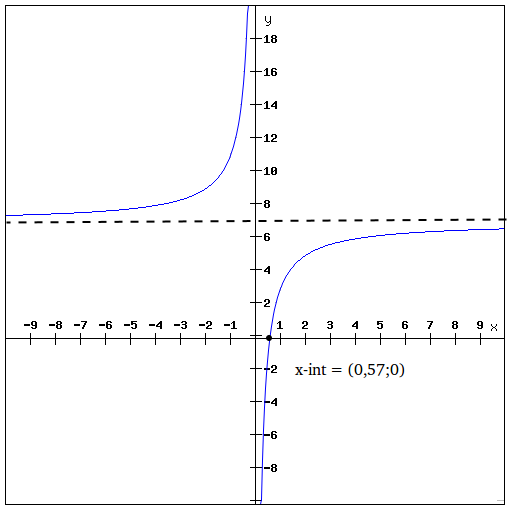
Draw the graph of
.
The domain is:
and the range is:
.
We look at the domain and range to determine where the asymptotes lie. From the domain we see that the function is undefined when
, so there is one asymptote at
. The other asymptote is found from the range. The function is undefined at
and so the second asymptote is at
There is no y-intercept for graphs of this form.
The x-intercept occurs when
. Calculating the x-intercept gives:
So there is one x-intercept at
.
Putting all this together gives us the following graph: