<< Chapter < Page Chapter >> Page >
Describes various classifications of signals.

Introduction

This module will begin our study of signals and systems by laying out some of the fundamentals of signal classification. It is essentially an introduction to the important definitions andproperties that are fundamental to the discussion of signals and systems, with a brief discussion of each.

Classifications of signals

Continuous-time vs. discrete-time

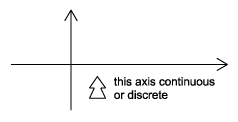
As the names suggest, this classification is determined by whether or not the time axis is discrete (countable) or continuous ( [link] ). A continuous-time signal will contain a value for all real numbers along the time axis.In contrast to this, a discrete-time signal , often created by sampling a continuous signal, willonly have values at equally spaced intervals along the time axis.

Analog vs. digital

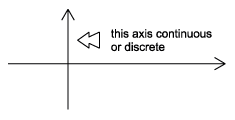
The difference between analog and digital is similar to the difference between continuous-time and discrete-time. However, in this casethe difference involves the values of the function. Analog corresponds to a continuous set of possible function values, while digital corresponds to a discreteset of possible function values. An common example of a digital signal is a binary sequence, where the values of the function can only be oneor zero.

Periodic vs. aperiodic

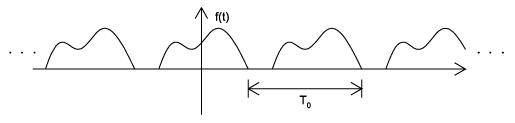
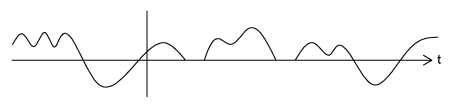
Periodic signals repeat with some period T , while aperiodic, or nonperiodic, signals do not ( [link] ). We can define a periodic function through the followingmathematical expression, where t can be any number and T is a positive constant:

f t f t T
fundamental period of our function, f t , is the smallest value of T that the still allows [link] to be true.

A periodic signal with period T 0
An aperiodic signal

Finite vs. infinite length

Another way of classifying a signal is in terms of its length along its time axis. Is the signal defined for all possible values of time, or for only certain values of time? Mathematically speaking, f t is a finite-length signal if it is defined only over a finite interval t 1 t t 2 where t 1 t 2 . Similarly, an infinite-length signal , f t , is defined for all values: t

Causal vs. anticausal vs. noncausal

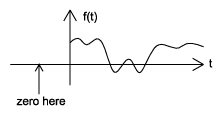
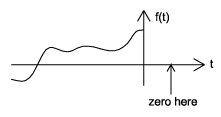
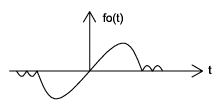
Causal signals are signals that are zero for all negative time, while anticausal are signals that are zero for all positive time. Noncausal signals are signals that have nonzero values in both positive and negative time ( [link] ).
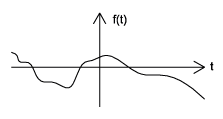
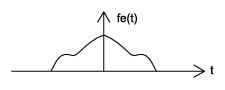
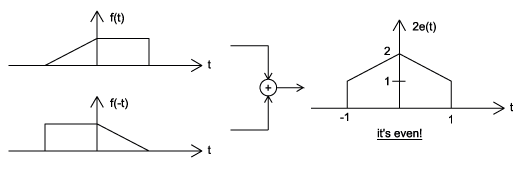
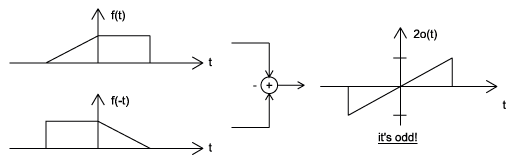
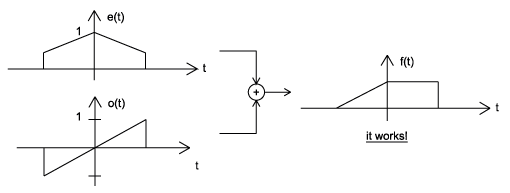
A causal signal
An anticausal signal
A noncausal signal

Even vs. odd

An even signal is any signal f such that f t f t . Even signals can be easily spotted as they are symmetric around the vertical axis. An odd signal , on the other hand, is a signal f such that f t f t ( [link] ).

An even signal
An odd signal

Using the definitions of even and odd signals, we can show that any signal can be written as a combination of an even andodd signal. That is, every signal has an odd-even decomposition. To demonstrate this, we have to look nofurther than a single equation.

f t 1 2 f t f t 1 2 f t f t
By multiplying and adding this expression out, it can be shown to be true. Also, it can be shown that f t f t fulfills the requirement of an even function, while f t f t fulfills the requirement of an odd function ( [link] ).

The signal we will decompose using odd-even decomposition
Even part: e t 1 2 f t f t
Odd part: o t 1 2 f t f t
Check: e t o t f t
Got questions? Get instant answers now!

Deterministic vs. random

A deterministic signal is a signal in which each value of the signal is fixed, being determined by amathematical expression, rule, or table. On the other hand, the values of a random signal are not strictly defined, but are subject to some amount of variability.

Deterministic Signal
Random Signal

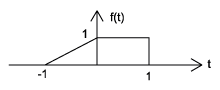
Consider the signal defined for all real t described by

f ( t ) = sin ( 2 π t ) / t t 1 0 t < 1

This signal is continuous time, analog, aperiodic, infinite length, causal, neither even nor odd, and, by definition, deterministic.

Got questions? Get instant answers now!

Signal classifications summary

This module describes just some of the many ways in which signals can be classified. They can be continuous time or discrete time, analog or digital, periodic or aperiodic, finite or infinite, and deterministic or random. We can also divide them based on their causality and symmetry properties.

Questions & Answers

differentiate between demand and supply giving examples
Lambiv Reply
differentiated between demand and supply using examples
Lambiv
what is labour ?
Lambiv
how will I do?
Venny Reply
how is the graph works?I don't fully understand
Rezat Reply
information
Eliyee
devaluation
Eliyee
t
WARKISA
hi guys good evening to all
Lambiv
multiple choice question
Aster Reply
appreciation
Eliyee
explain perfect market
Lindiwe Reply
In economics, a perfect market refers to a theoretical construct where all participants have perfect information, goods are homogenous, there are no barriers to entry or exit, and prices are determined solely by supply and demand. It's an idealized model used for analysis,
Ezea
What is ceteris paribus?
Shukri Reply
other things being equal
AI-Robot
When MP₁ becomes negative, TP start to decline. Extuples Suppose that the short-run production function of certain cut-flower firm is given by: Q=4KL-0.6K2 - 0.112 • Where is quantity of cut flower produced, I is labour input and K is fixed capital input (K-5). Determine the average product of lab
Kelo
Extuples Suppose that the short-run production function of certain cut-flower firm is given by: Q=4KL-0.6K2 - 0.112 • Where is quantity of cut flower produced, I is labour input and K is fixed capital input (K-5). Determine the average product of labour (APL) and marginal product of labour (MPL)
Kelo
yes,thank you
Shukri
Can I ask you other question?
Shukri
what is monopoly mean?
Habtamu Reply
What is different between quantity demand and demand?
Shukri Reply
Quantity demanded refers to the specific amount of a good or service that consumers are willing and able to purchase at a give price and within a specific time period. Demand, on the other hand, is a broader concept that encompasses the entire relationship between price and quantity demanded
Ezea
ok
Shukri
how do you save a country economic situation when it's falling apart
Lilia Reply
what is the difference between economic growth and development
Fiker Reply
Economic growth as an increase in the production and consumption of goods and services within an economy.but Economic development as a broader concept that encompasses not only economic growth but also social & human well being.
Shukri
production function means
Jabir
What do you think is more important to focus on when considering inequality ?
Abdisa Reply
any question about economics?
Awais Reply
sir...I just want to ask one question... Define the term contract curve? if you are free please help me to find this answer 🙏
Asui
it is a curve that we get after connecting the pareto optimal combinations of two consumers after their mutually beneficial trade offs
Awais
thank you so much 👍 sir
Asui
In economics, the contract curve refers to the set of points in an Edgeworth box diagram where both parties involved in a trade cannot be made better off without making one of them worse off. It represents the Pareto efficient allocations of goods between two individuals or entities, where neither p
Cornelius
In economics, the contract curve refers to the set of points in an Edgeworth box diagram where both parties involved in a trade cannot be made better off without making one of them worse off. It represents the Pareto efficient allocations of goods between two individuals or entities,
Cornelius
Suppose a consumer consuming two commodities X and Y has The following utility function u=X0.4 Y0.6. If the price of the X and Y are 2 and 3 respectively and income Constraint is birr 50. A,Calculate quantities of x and y which maximize utility. B,Calculate value of Lagrange multiplier. C,Calculate quantities of X and Y consumed with a given price. D,alculate optimum level of output .
Feyisa Reply
Answer
Feyisa
c
Jabir
the market for lemon has 10 potential consumers, each having an individual demand curve p=101-10Qi, where p is price in dollar's per cup and Qi is the number of cups demanded per week by the i th consumer.Find the market demand curve using algebra. Draw an individual demand curve and the market dema
Gsbwnw Reply
suppose the production function is given by ( L, K)=L¼K¾.assuming capital is fixed find APL and MPL. consider the following short run production function:Q=6L²-0.4L³ a) find the value of L that maximizes output b)find the value of L that maximizes marginal product
Abdureman
types of unemployment
Yomi Reply
What is the difference between perfect competition and monopolistic competition?
Mohammed
Got questions? Join the online conversation and get instant answers!
Jobilize.com Reply

Get Jobilize Job Search Mobile App in your pocket Now!

Get it on Google Play Download on the App Store Now


Source:  OpenStax, Signals and systems. OpenStax CNX. Aug 14, 2014 Download for free at http://legacy.cnx.org/content/col10064/1.15
Google Play and the Google Play logo are trademarks of Google Inc.

Notification Switch

Would you like to follow the 'Signals and systems' conversation and receive update notifications?

Ask