

| << Chapter < Page | Chapter >> Page > |
| Figure 10. Graphic output for Case 5. |
|---|
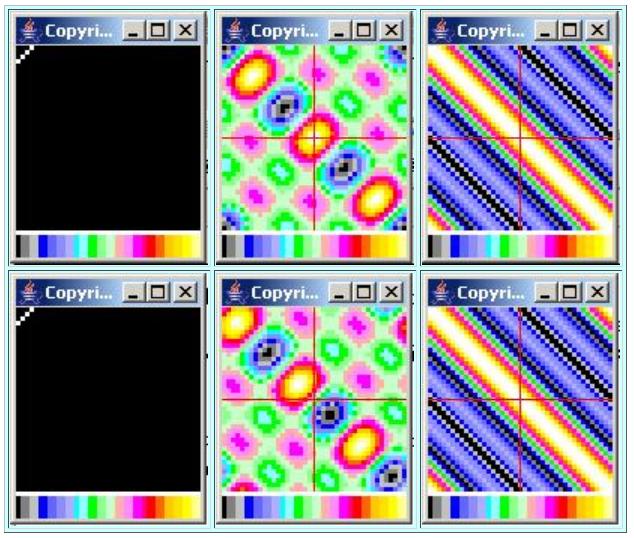 |
If you compare Figure 10 with Figure 9 , you will see that the spectral result is rotated ninety degrees relative to that shown for Case 4 where the line wasalong the diagonal. In other words, rotating the line of points by ninety degrees also rotated the structure in the wavenumber spectrum by ninety degrees.
In addition, the line of points for Case 5 is shorter than the line of points for Case 4 resulting in a wider peak in the rectified sin(x)/x shape for Case 5.
While the real and imaginary parts of the spectrum shown in the center of Figure 10 are considerably different from anything that we have seen prior to this, they still satisfy the symmetry and asymmetry conditions that we expect for the real and imaginary parts.
The output from the inverse Fourier transform in the bottom left image in Figure 10 matches the input surface in the top left image in Figure 10 .
All of this matches our expectations for this case.
This case is considerably more complicated than the previous cases. You can view the surface for this case in the top-left image in Figure 11 . You can view the code that generated this surface in Listing 22 near the end of the module.
| Figure 11. Graphic output for Case 6. |
|---|
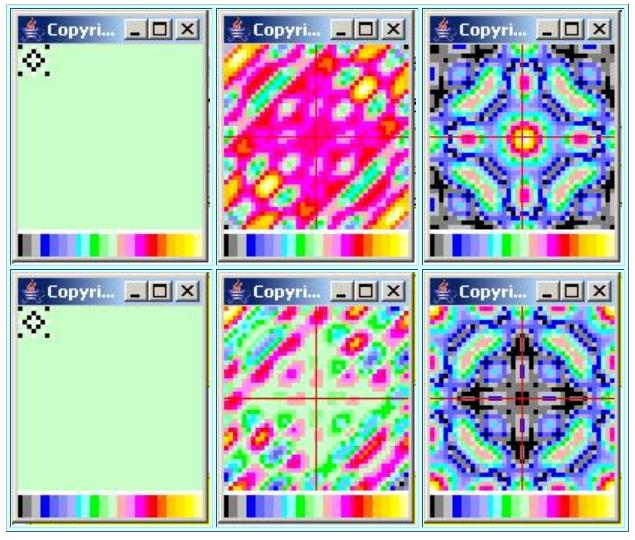 |
This case draws horizontal lines, vertical lines, and lines on both diagonals. Each individual point on each line is given a value of either +1 or-1. The weights of the individual points are adjusted so that the sum of all the weights is 0. The weight at the point where the lines intersect is also 0.
The small black squares in the top-left image in Figure 11 represent points with a weight of -1. The small white squares represent points with a weight of+1. The green background color represents a value of 0.
The wavenumber amplitude spectrum is shown in the bottom right image in Figure 11 . As you can see from that image, performing a 2D Fourier transform on this surface produces a wavenumber amplitude spectrum that is symmetrical alonglines drawn at 0, 45, 90, and 135 degrees to the horizontal. There is a line of symmetry in the amplitude spectrum for every line of points on the space domainsurface.
Because the sum of all the points is 0, the value of the wavenumber spectrum at the origin must also be zero. This is indicated by the black square at theorigin in the lower right image.
This amplitude spectrum has major peaks at the folding wave number on each of the 45-degree axes. In addition, there are minor peaks at various other pointsin the spectrum.
As expected, the real and imaginary parts of the spectrum, shown in the center of Figure 11 exhibit the required symmetry and asymmetry that I discussed earlier.
The output produced by performing an inverse Fourier transform on the complex wavenumber spectrum is shown in the lower-left image in Figure 11 . This image matches the input surface shown in the top left image in Figure 11 .
Notification Switch
Would you like to follow the 'Digital signal processing - dsp' conversation and receive update notifications?

|
|

|
|

|
|

|
|

|
|

|
|

|
|

|
|

|
|

|