

| << Chapter < Page | Chapter >> Page > |
This normalization is applied even when the distance between the highest and lowest elevation is very small. As a result of computational errors, theamplitude spectrum is not perfectly flat. Rather there are very small variations from one point to the next. As a result, the colors used to plot the surfaceswitch among the full range of available colors even for tiny deviations fromperfect flatness.
The total error for this case is very small. The numeric output shows that the final output surface matches the input surface to within an error that isless than about one part in ten to the thirteenth power. The program produces the expected results for this test case.
Now we are going to take a look at another case for which we know in advance generally what the outcome should be. This will allow us to compare the outcomewith our expectations to confirm proper operation of the program.
This case places a box that is one unit tall on the diagonal near the origin in the space domain as shown in the top-left image in Figure 7 .
| Figure 7. A box on the diagonal in space. |
|---|
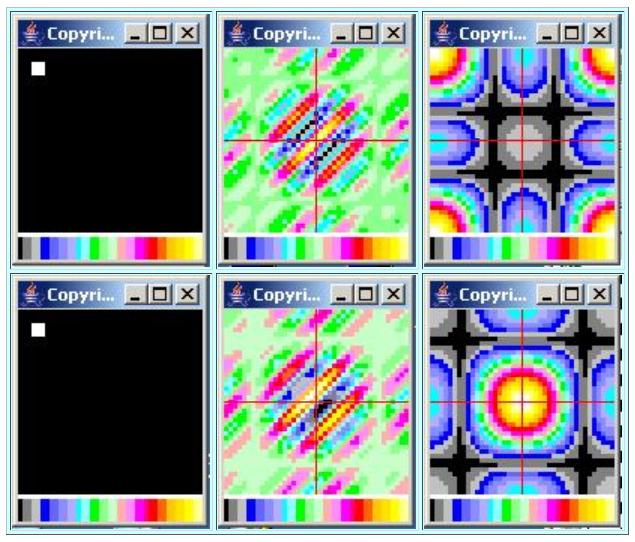 |
On the basis of prior experience, we know that the amplitude spectrum of this surface along the horizontal and vertical axes of the wavenumber spectrum shouldhave a rectified sin(x)/x shape (all negative values are converted to positive values) . We know that the peak in this amplitude spectrum should appear at the origin in wavenumber space, and that the width of the peak shouldbe inversely proportional to the size of the box.
The code that constructs the space domain surface for this case is shown in Listing 17 .
| Listing 17. Code for Case 2. |
|---|
case 2:
        spatialData[3][3] = 1;spatialData[3][4]= 1;
        spatialData[3][5] = 1;spatialData[4][3]= 1;
        spatialData[4][4] = 1;spatialData[4][5]= 1;
        spatialData[5][3] = 1;spatialData[5][4]= 1;
spatialData[5][5] = 1;break; |
This code is completely straightforward. It sets the value of each of nine adjacent points on the surface to a value of 1, while the values of all otherpoints on the surface remain at zero. The arrangement of those nine points forms a square whose sides are parallel to the horizontal and vertical axes.
There isn't a lot that I can tell you about what to expect regarding the real and imaginary parts of this spectrum, other than that they should exhibit thesame symmetry and asymmetry conditions that I described earlier for the real and imaginary parts in general. Theserequirements appear to be satisfied by the real part at the top center of Figure 7 and the imaginary part at the bottom center of Figure 7 .
Otherwise, the shape of the real and imaginary wavenumber spectra will depend on the location of the box in space and the size and orientation of the box.
Notification Switch
Would you like to follow the 'Digital signal processing - dsp' conversation and receive update notifications?

|
|

|
|

|
|

|
|
|
|
|
|
|

|
|

|
|

|
|

|