

| << Chapter < Page | Chapter >> Page > |
The temperature and pressure conditions at which a substance exists in solid, liquid, and gaseous states are summarized in a phase diagram for that substance. Phase diagrams are combined plots of three pressure-temperature equilibrium curves: solid-liquid, liquid-gas, and solid-gas. These curves represent the relationships between phase-transition temperatures and pressures. The point of intersection of all three curves represents the substance’s triple point—the temperature and pressure at which all three phases are in equilibrium. At pressures below the triple point, a substance cannot exist in the liquid state, regardless of its temperature. The terminus of the liquid-gas curve represents the substance’s critical point, the pressure and temperature above which a liquid phase cannot exist.
From the phase diagram for water ( [link] ), determine the state of water at:
(a) 35 °C and 85 kPa
(b) −15 °C and 40 kPa
(c) −15 °C and 0.1 kPa
(d) 75 °C and 3 kPa
(e) 40 °C and 0.1 kPa
(f) 60 °C and 50 kPa
What phase changes will take place when water is subjected to varying pressure at a constant temperature of 0.005 °C? At 40 °C? At −40 °C?
At low pressures and 0.005 °C, the water is a gas. As the pressure increases to 4.6 torr, the water becomes a solid; as the pressure increases still more, it becomes a liquid. At 40 °C, water at low pressure is a vapor; at pressures higher than about 75 torr, it converts into a liquid. At −40 °C, water goes from a gas to a solid as the pressure increases above very low values.
Pressure cookers allow food to cook faster because the higher pressure inside the pressure cooker increases the boiling temperature of water. A particular pressure cooker has a safety valve that is set to vent steam if the pressure exceeds 3.4 atm. What is the approximate maximum temperature that can be reached inside this pressure cooker? Explain your reasoning.
From the phase diagram for carbon dioxide in [link] , determine the state of CO 2 at:
(a) 20 °C and 1000 kPa
(b) 10 °C and 2000 kPa
(c) 10 °C and 100 kPa
(d) −40 °C and 500 kPa
(e) −80 °C and 1500 kPa
(f) −80 °C and 10 kPa
(a) liquid; (b) solid; (c) gas; (d) gas; (e) gas; (f) gas
Determine the phase changes that carbon dioxide undergoes as the pressure changes if the temperature is held at −50 °C? If the temperature is held at −40 °C? At 20 °C? (See the phase diagram in [link] .)
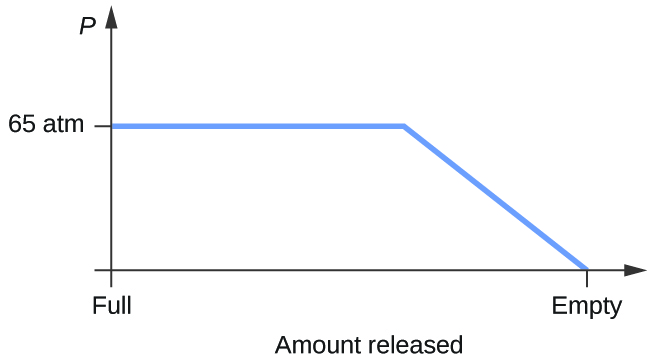
Consider a cylinder containing a mixture of liquid carbon dioxide in equilibrium with gaseous carbon dioxide at an initial pressure of 65 atm and a temperature of 20 °C. Sketch a plot depicting the change in the cylinder pressure with time as gaseous carbon dioxide is released at constant temperature.
Dry ice, CO 2 ( s ), does not melt at atmospheric pressure. It sublimes at a temperature of −78 °C. What is the lowest pressure at which CO 2 ( s ) will melt to give CO 2 ( l )? At approximately what temperature will this occur? (See [link] for the phase diagram.)
If a severe storm results in the loss of electricity, it may be necessary to use a clothesline to dry laundry. In many parts of the country in the dead of winter, the clothes will quickly freeze when they are hung on the line. If it does not snow, will they dry anyway? Explain your answer.
Yes, ice will sublime, although it may take it several days. Ice has a small vapor pressure, and some ice molecules form gas and escape from the ice crystals. As time passes, more and more solid converts to gas until eventually the clothes are dry.
Is it possible to liquefy nitrogen at room temperature (about 25 °C)? Is it possible to liquefy sulfur dioxide at room temperature? Explain your answers.
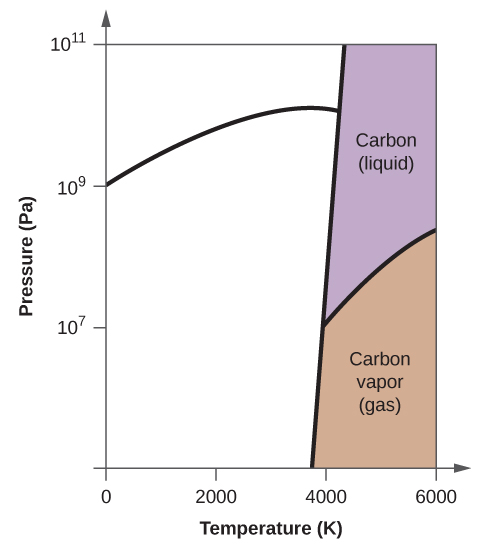
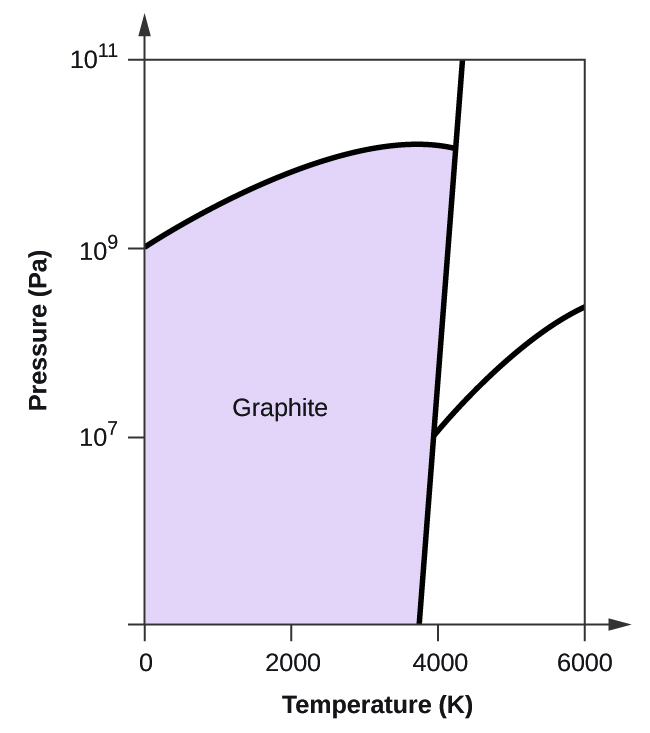
Elemental carbon has one gas phase, one liquid phase, and two different solid phases, as shown in the phase diagram:
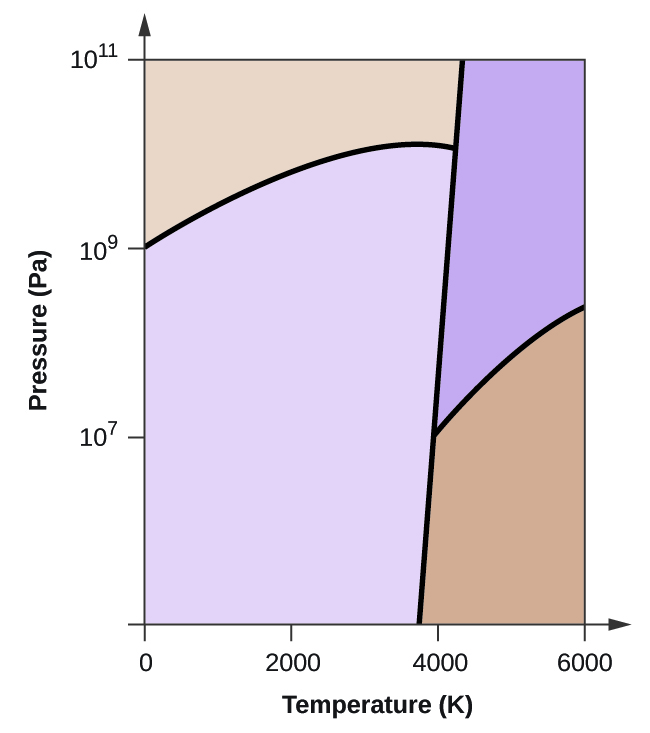
(a) On the phase diagram, label the gas and liquid regions.
(b) Graphite is the most stable phase of carbon at normal conditions. On the phase diagram, label the graphite phase.
(c) If graphite at normal conditions is heated to 2500 K while the pressure is increased to 10 10 Pa, it is converted into diamond. Label the diamond phase.
(d) Circle each triple point on the phase diagram.
(e) In what phase does carbon exist at 5000 K and 10 8 Pa?
(f) If the temperature of a sample of carbon increases from 3000 K to 5000 K at a constant pressure of 10 6 Pa, which phase transition occurs, if any?
(a)
(b)
(c)
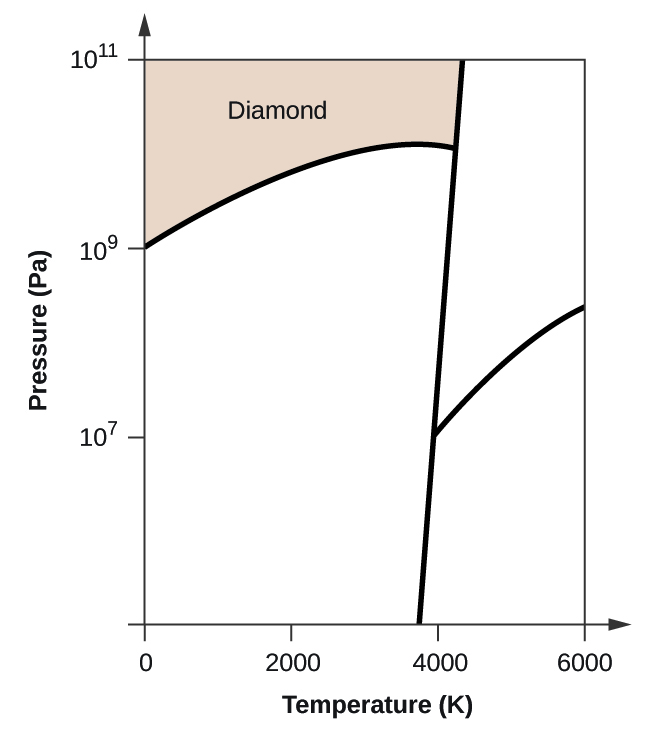
(d)
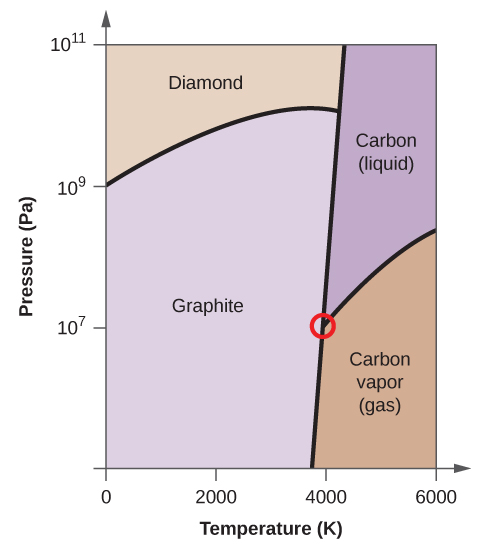
(e) liquid phase (f) sublimation
Notification Switch
Would you like to follow the 'Chemistry' conversation and receive update notifications?

|
|
|
|
|

|
|

|
|

|
|

|
|

|
|

|
|

|
|

|
|

|
|

|