<< Chapter < Page Chapter >> Page >
bond order = ( number of bonding electrons ) ( number of antibonding electrons ) 2

The order of a covalent bond is a guide to its strength; a bond between two given atoms becomes stronger as the bond order increases ( [link] ). If the distribution of electrons in the molecular orbitals between two atoms is such that the resulting bond would have a bond order of zero, a stable bond does not form. We next look at some specific examples of MO diagrams and bond orders.

Bonding in diatomic molecules

A dihydrogen molecule (H 2 ) forms from two hydrogen atoms. When the atomic orbitals of the two atoms combine, the electrons occupy the molecular orbital of lowest energy, the σ 1 s bonding orbital. A dihydrogen molecule, H 2 , readily forms because the energy of a H 2 molecule is lower than that of two H atoms. The σ 1 s orbital that contains both electrons is lower in energy than either of the two 1 s atomic orbitals.

A molecular orbital can hold two electrons, so both electrons in the H 2 molecule are in the σ 1 s bonding orbital; the electron configuration is ( σ 1 s ) 2 . We represent this configuration by a molecular orbital energy diagram ( [link] ) in which a single upward arrow indicates one electron in an orbital, and two (upward and downward) arrows indicate two electrons of opposite spin.

A diagram is shown that has an upward-facing vertical arrow running along the left side labeled “E.” At the bottom center of the diagram is a horizontal line labeled, “sigma subscript 1 s,” that has two vertical half arrows drawn on it, one facing up and one facing down. This line is connected to the right and left by upward-facing, dotted lines to two more horizontal lines, each labeled, “1 s,” and each with one vertical half-arrow facing up drawn on it. These two lines are connected by upward-facing dotted lines to another line in the center of the diagram, but farther up from the first, and labeled, “sigma subscript 1 s superscript asterisk.” The left and right sides of the diagram have headers that read, ”Atomic orbitals,” while the center header reads, “Molecular orbitals.” The bottom left and right are labeled “H” while the center is labeled “H subscript 2.”
The molecular orbital energy diagram predicts that H 2 will be a stable molecule with lower energy than the separated atoms.

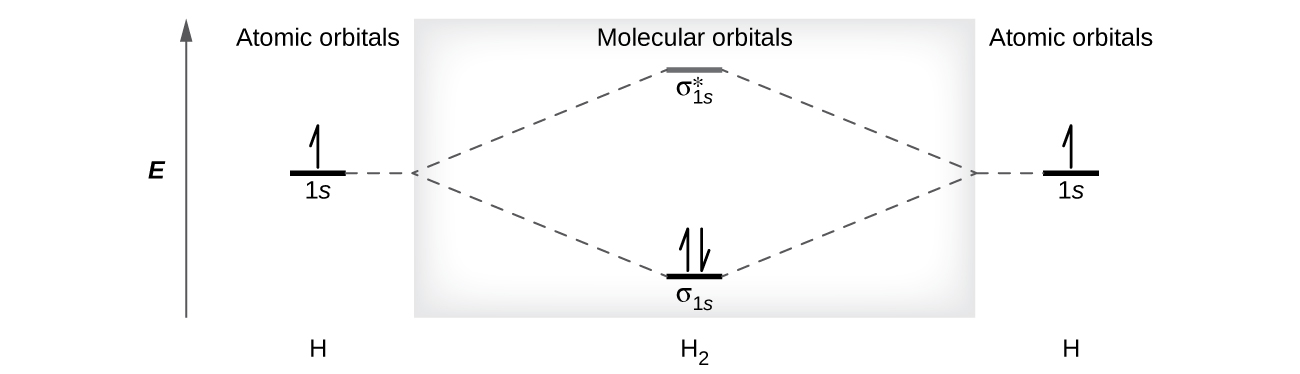
A dihydrogen molecule contains two bonding electrons and no antibonding electrons so we have

bond order in H 2 = ( 2 0 ) 2 = 1

Because the bond order for the H–H bond is equal to 1, the bond is a single bond.

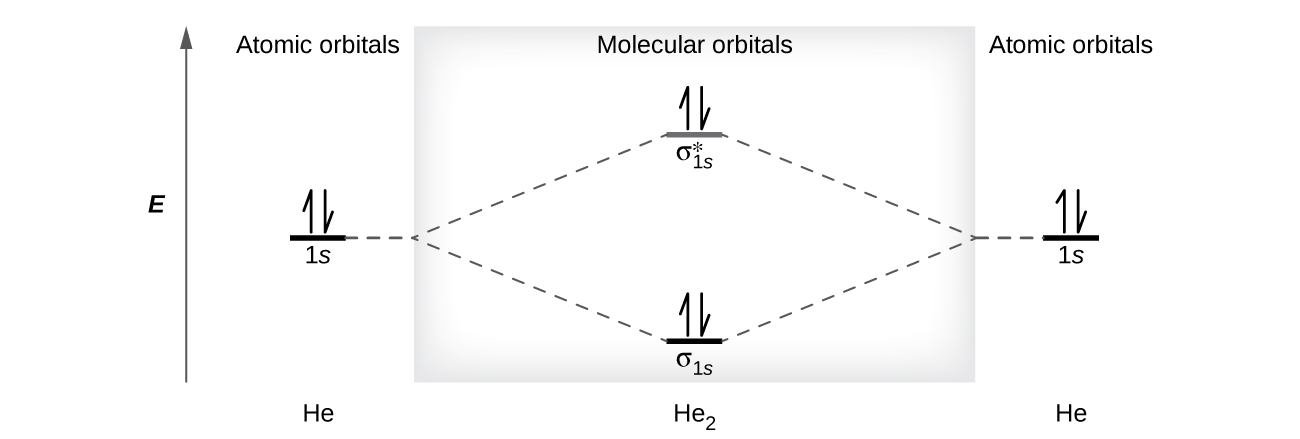
A helium atom has two electrons, both of which are in its 1 s orbital. Two helium atoms do not combine to form a dihelium molecule, He 2 , with four electrons, because the stabilizing effect of the two electrons in the lower-energy bonding orbital would be offset by the destabilizing effect of the two electrons in the higher-energy antibonding molecular orbital. We would write the hypothetical electron configuration of He 2 as ( σ 1 s ) 2 ( σ 1 s * ) 2 as in [link] . The net energy change would be zero, so there is no driving force for helium atoms to form the diatomic molecule. In fact, helium exists as discrete atoms rather than as diatomic molecules. The bond order in a hypothetical dihelium molecule would be zero.

bond order in He 2 = ( 2 2 ) 2 = 0

A bond order of zero indicates that no bond is formed between two atoms.

A diagram is shown that has an upward-facing vertical arrow running along the left side labeled, “E.” At the bottom center of the diagram is a horizontal line labeled, “sigma subscript 1 s,” that has two vertical half arrows drawn on it, one facing up and one facing down. This line is connected to the right and left by upward-facing, dotted lines to two more horizontal lines, each labeled, “1 s,” and each with one vertical half-arrow facing up and one facing down drawn on it. These two lines are connected by upward-facing dotted lines to another line in the center of the diagram, but farther up from the first, and labeled, “sigma subscript 1 s superscript asterisk.” This line has one upward-facing and one downward-facing vertical arrow drawn on it. The left and right sides of the diagram have headers that read, “Atomic orbitals,” while the center header reads, “Molecular orbitals.” The bottom left and right are labeled, “H e,” while the center is labeled, “H e subscript 2.”
The molecular orbital energy diagram predicts that He 2 will not be a stable molecule, since it has equal numbers of bonding and antibonding electrons.

The diatomic molecules of the second period

Eight possible homonuclear diatomic molecules might be formed by the atoms of the second period of the periodic table: Li 2 , Be 2 , B 2 , C 2 , N 2 , O 2 , F 2 , and Ne 2 . However, we can predict that the Be 2 molecule and the Ne 2 molecule would not be stable. We can see this by a consideration of the molecular electron configurations ( [link] ).

We predict valence molecular orbital electron configurations just as we predict electron configurations of atoms. Valence electrons are assigned to valence molecular orbitals with the lowest possible energies. Consistent with Hund’s rule, whenever there are two or more degenerate molecular orbitals, electrons fill each orbital of that type singly before any pairing of electrons takes place.

Questions & Answers

Ayele, K., 2003. Introductory Economics, 3rd ed., Addis Ababa.
Widad Reply
can you send the book attached ?
Ariel
?
Ariel
What is economics
Widad Reply
the study of how humans make choices under conditions of scarcity
AI-Robot
U(x,y) = (x×y)1/2 find mu of x for y
Desalegn Reply
U(x,y) = (x×y)1/2 find mu of x for y
Desalegn
what is ecnomics
Jan Reply
this is the study of how the society manages it's scarce resources
Belonwu
what is macroeconomic
John Reply
macroeconomic is the branch of economics which studies actions, scale, activities and behaviour of the aggregate economy as a whole.
husaini
etc
husaini
difference between firm and industry
husaini Reply
what's the difference between a firm and an industry
Abdul
firm is the unit which transform inputs to output where as industry contain combination of firms with similar production 😅😅
Abdulraufu
Suppose the demand function that a firm faces shifted from Qd  120 3P to Qd  90  3P and the supply function has shifted from QS  20  2P to QS 10  2P . a) Find the effect of this change on price and quantity. b) Which of the changes in demand and supply is higher?
Toofiq Reply
explain standard reason why economic is a science
innocent Reply
factors influencing supply
Petrus Reply
what is economic.
Milan Reply
scares means__________________ends resources. unlimited
Jan
economics is a science that studies human behaviour as a relationship b/w ends and scares means which have alternative uses
Jan
calculate the profit maximizing for demand and supply
Zarshad Reply
Why qualify 28 supplies
Milan
what are explicit costs
Nomsa Reply
out-of-pocket costs for a firm, for example, payments for wages and salaries, rent, or materials
AI-Robot
concepts of supply in microeconomics
David Reply
economic overview notes
Amahle Reply
identify a demand and a supply curve
Salome Reply
i don't know
Parul
there's a difference
Aryan
Demand curve shows that how supply and others conditions affect on demand of a particular thing and what percent demand increase whith increase of supply of goods
Israr
Hi Sir please how do u calculate Cross elastic demand and income elastic demand?
Abari
Got questions? Join the online conversation and get instant answers!
Jobilize.com Reply

Get Jobilize Job Search Mobile App in your pocket Now!

Get it on Google Play Download on the App Store Now


Source:  OpenStax, Chemistry. OpenStax CNX. May 20, 2015 Download for free at http://legacy.cnx.org/content/col11760/1.9
Google Play and the Google Play logo are trademarks of Google Inc.

Notification Switch

Would you like to follow the 'Chemistry' conversation and receive update notifications?

Ask