Occurrence and Preparation of the Representative Metals
Structure and General Properties of the Metalloids
Structure and General Properties of the Nonmetals
Occurrence, Preparation, and Compounds of Hydrogen
Occurrence, Preparation, and Properties of Carbonates
Occurrence, Preparation, and Properties of Nitrogen
Occurrence, Preparation, and Properties of Phosphorus
Occurrence, Preparation, and Compounds of Oxygen
Occurrence, Preparation, and Properties of Sulfur
Occurrence, Preparation, and Properties of Halogens
Occurrence, Preparation, and Properties of the Noble Gases
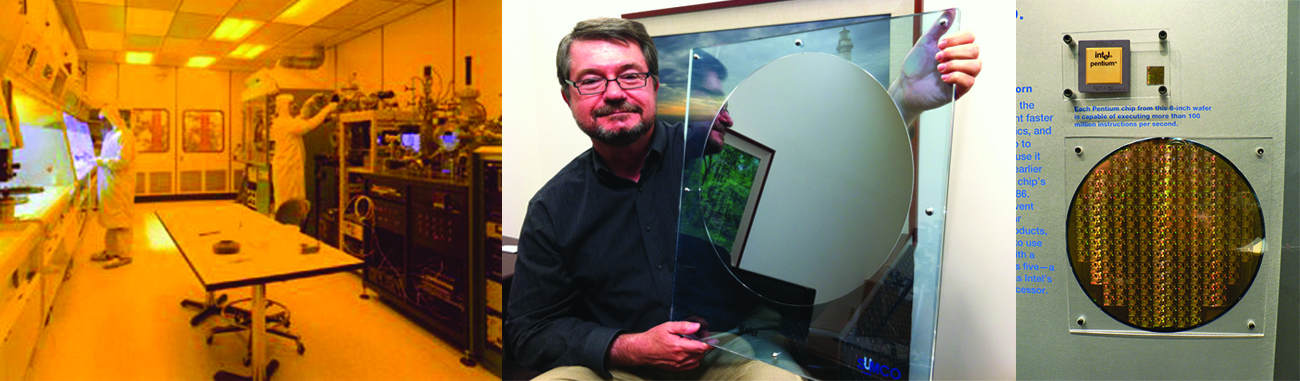
Purity is extremely important when preparing silicon wafers. Technicians in a cleanroom prepare silicon without impurities (left). The CEO of VLSI Research, Don Hutcheson, shows off a pure silicon wafer (center). A silicon wafer covered in Pentium chips is an enlarged version of the silicon wafers found in many electronics used today (right). (credit middle: modification of work by “Intel Free Press”/Flickr; credit right: modification of work by Naotake Murayama)
The development of the periodic table in the mid-1800s came from observations that there was a periodic relationship between the properties of the elements. Chemists, who have an understanding of the variations of these properties, have been able to use this knowledge to solve a wide variety of technical challenges. For example, silicon and other semiconductors form the backbone of modern electronics because of our ability to fine-tune the electrical properties of these materials. This chapter explores important properties of representative metals, metalloids, and nonmetals in the periodic table.
Step 1: Find the mean. To find the mean, add up all the scores, then divide them by the number of scores. ...
Step 2: Find each score's deviation from the mean. ...
Step 3: Square each deviation from the mean. ...
Step 4: Find the sum of squares. ...
Step 5: Divide the sum of squares by n – 1 or N.
The sample of 16 students is taken. The average age in the sample was 22 years with astandard deviation of 6 years. Construct a 95% confidence interval for the age of the population.
Bhartdarshan' is an internet-based travel agency wherein customer can see videos of the cities they plant to visit. The number of hits daily is a normally distributed random variable with a mean of 10,000 and a standard deviation of 2,400
a. what is the probability of getting more than 12,000 hits?
b. what is the probability of getting fewer than 9,000 hits?
Bhartdarshan'is an internet-based travel agency wherein customer can see videos of the cities they plan to visit. The number of hits daily is a normally distributed random variable with a mean of 10,000 and a standard deviation of 2,400.
a. What is the probability of getting more than 12,000 hits