

| << Chapter < Page | Chapter >> Page > |
Notice that the reaction rates vary with time, decreasing as the reaction proceeds. Results for the last 6-hour period yield a reaction rate of:
This behavior indicates the reaction continually slows with time. Using the concentrations at the beginning and end of a time period over which the reaction rate is changing results in the calculation of an average rate for the reaction over this time interval. At any specific time, the rate at which a reaction is proceeding is known as its instantaneous rate . The instantaneous rate of a reaction at “time zero,” when the reaction commences, is its initial rate . Consider the analogy of a car slowing down as it approaches a stop sign. The vehicle’s initial rate—analogous to the beginning of a chemical reaction—would be the speedometer reading at the moment the driver begins pressing the brakes ( t 0 ). A few moments later, the instantaneous rate at a specific moment—call it t 1 —would be somewhat slower, as indicated by the speedometer reading at that point in time. As time passes, the instantaneous rate will continue to fall until it reaches zero, when the car (or reaction) stops. Unlike instantaneous speed, the car’s average speed is not indicated by the speedometer; but it can be calculated as the ratio of the distance traveled to the time required to bring the vehicle to a complete stop (Δ t ). Like the decelerating car, the average rate of a chemical reaction will fall somewhere between its initial and final rates.
The instantaneous rate of a reaction may be determined one of two ways. If experimental conditions permit the measurement of concentration changes over very short time intervals, then average rates computed as described earlier provide reasonably good approximations of instantaneous rates. Alternatively, a graphical procedure may be used that, in effect, yields the results that would be obtained if short time interval measurements were possible. If we plot the concentration of hydrogen peroxide against time, the instantaneous rate of decomposition of H 2 O 2 at any time t is given by the slope of a straight line that is tangent to the curve at that time ( [link] ). We can use calculus to evaluating the slopes of such tangent lines, but the procedure for doing so is beyond the scope of this chapter.
![A graph is shown with the label, “Time ( h ),” appearing on the x-axis and “[ H subscript 2 O subscript 2 ] ( mol L superscript negative 1)” on the y-axis. The x-axis markings begin at 0 and end at 24. The markings are labeled at intervals of 6. The y-axis begins at 0 and includes markings every 0.200, up to 1.000. A decreasing, concave up, non-linear curve is shown, which begins at 1.000 on the y-axis and nearly reaches a value of 0 at the far right of the graph around 10 on the x-axis. A red tangent line segment is drawn on the graph at the point where the graph intersects the y-axis. A second red tangent line segment is drawn near the middle of the curve. A vertical dashed line segment extends from the left endpoint of the line segment downward to intersect with a similar horizontal line segment drawn from the right endpoint of the line segment, forming a right triangle beneath the curve. The vertical leg of the triangle is labeled “capital delta [ H subscript 2 O subscript 2 ]” and the horizontal leg is labeled, “capital delta t.”](/ocw/mirror/col11760/m51097/CNX_Chem_12_01_RRateIll.jpg)
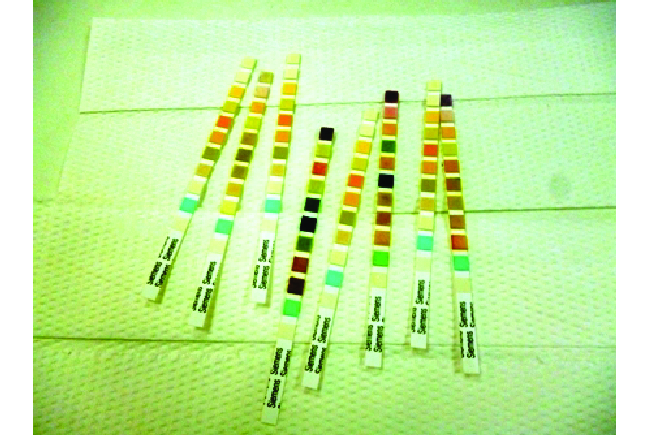
Physicians often use disposable test strips to measure the amounts of various substances in a patient’s urine ( [link] ). These test strips contain various chemical reagents, embedded in small pads at various locations along the strip, which undergo changes in color upon exposure to sufficient concentrations of specific substances. The usage instructions for test strips often stress that proper read time is critical for optimal results. This emphasis on read time suggests that kinetic aspects of the chemical reactions occurring on the test strip are important considerations.
The test for urinary glucose relies on a two-step process represented by the chemical equations shown here:
The first equation depicts the oxidation of glucose in the urine to yield glucolactone and hydrogen peroxide. The hydrogen peroxide produced subsequently oxidizes colorless iodide ion to yield brown iodine, which may be visually detected. Some strips include an additional substance that reacts with iodine to produce a more distinct color change.
The two test reactions shown above are inherently very slow, but their rates are increased by special enzymes embedded in the test strip pad. This is an example of catalysis , a topic discussed later in this chapter. A typical glucose test strip for use with urine requires approximately 30 seconds for completion of the color-forming reactions. Reading the result too soon might lead one to conclude that the glucose concentration of the urine sample is lower than it actually is (a false-negative result). Waiting too long to assess the color change can lead to a false positive due to the slower (not catalyzed) oxidation of iodide ion by other substances found in urine.
Notification Switch
Would you like to follow the 'Chemistry' conversation and receive update notifications?

|
|
|
|
|

|
|

|
|

|
|
|
|
|

|
|

|
|

|
|

|
|
|
|
|

|