Home
Chemistry Chemistry
Water properties
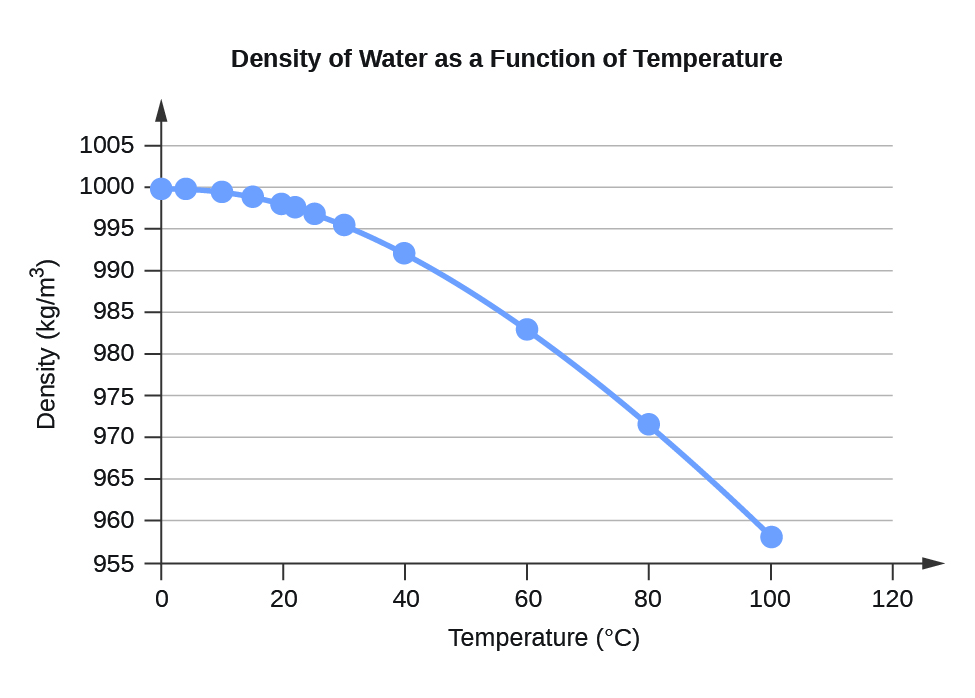
Water Density (kg/m
3 ) at Different Temperatures (°C)
Temperature
Density
0
999.8395
4
999.9720 (density maximum)
10
999.7026
15
999.1026
20
998.2071
22
997.7735
25
997.0479
30
995.6502
40
992.2
60
983.2
80
971.8
100
958.4
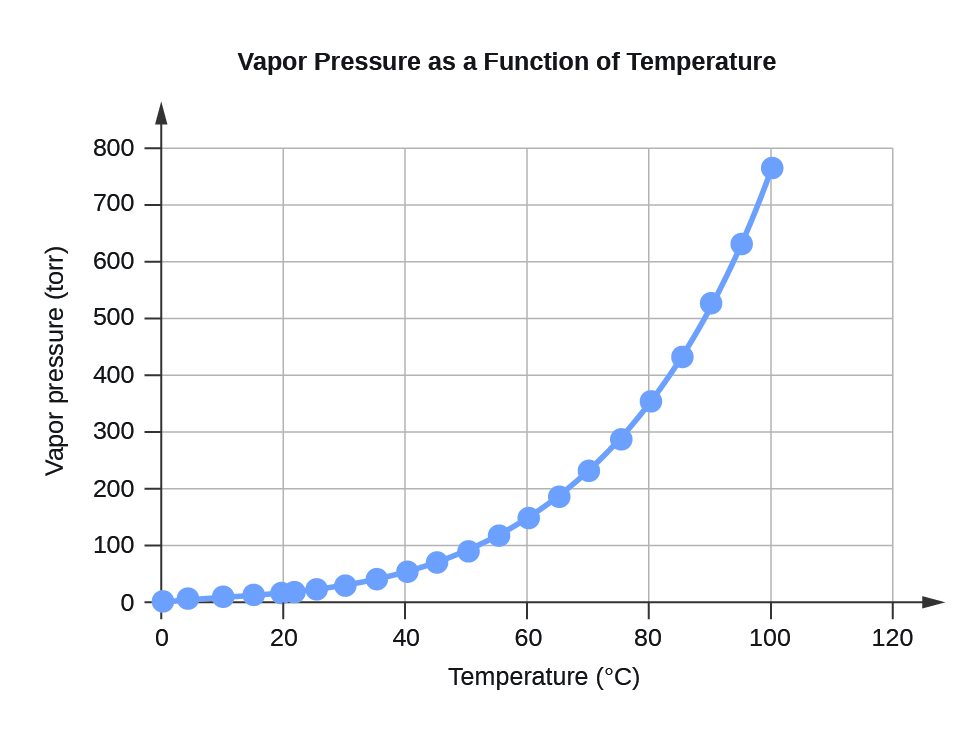
Water Vapor Pressure at Different Temperatures (°C)
Temperature
Vapor Pressure (torr)
Vapor Pressure (Pa)
0
4.6
613.2812
4
6.1
813.2642
10
9.2
1226.562
15
12.8
1706.522
20
17.5
2333.135
22
19.8
2639.776
25
23.8
3173.064
30
31.8
4239.64
35
42.2
5626.188
40
55.3
7372.707
45
71.9
9585.852
50
92.5
12332.29
55
118.0
15732
60
149.4
19918.31
65
187.5
24997.88
70
233.7
31157.35
75
289.1
38543.39
80
355.1
47342.64
85
433.6
57808.42
90
525.8
70100.71
95
633.9
84512.82
100
760.0
101324.7
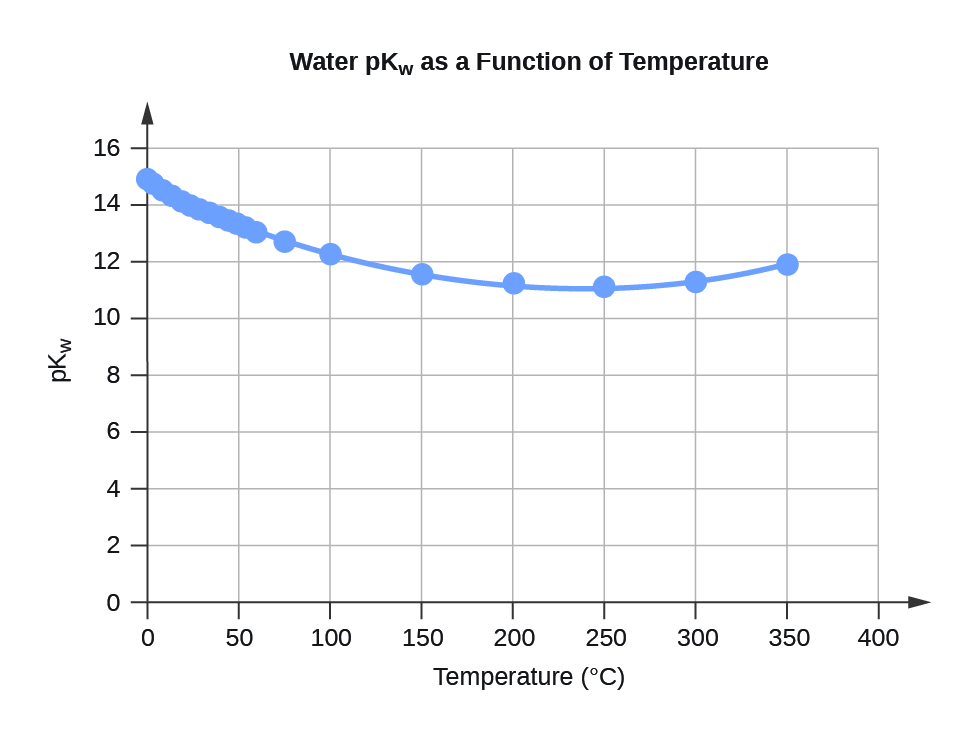
Water K
w and pK
w at Different Temperatures (°C)
Temperature
K
w 10
–14
pK
w
0
0.112
14.95
5
0.182
14.74
10
0.288
14.54
15
0.465
14.33
20
0.671
14.17
25
0.991
14.00
30
1.432
13.84
35
2.042
13.69
40
2.851
13.55
45
3.917
13.41
50
5.297
13.28
55
7.080
13.15
60
9.311
13.03
75
19.95
12.70
100
56.23
12.25
Specific Heat Capacity for Water
C°(H
2 O(
l )) = 4184 J∙K
−1 ∙kg
−1 = 4.184 J∙g
-1 ∙°C
-1
C°(H
2 O(
s )) = 1864 J∙K
−1 ∙kg
−1
C°(H
2 O(
g )) = 2093 J∙K
−1 ∙kg
−1
Standard Water Melting and Boiling Temperatures and Enthalpies of the Transitions
Temperature (K)
Δ
H (kJ/mol)
melting
273.15
6.088
boiling
373.15
40.656 (44.016 at 298 K)
Water Cryoscopic (Freezing Point Depression) and Ebullioscopic (Boiling Point Elevation) Constants
K
f = 1.86°C∙kg∙mol
−1 (cryoscopic constant)
K
b = 0.51°C∙kg∙mol
−1 (ebullioscopic constant)
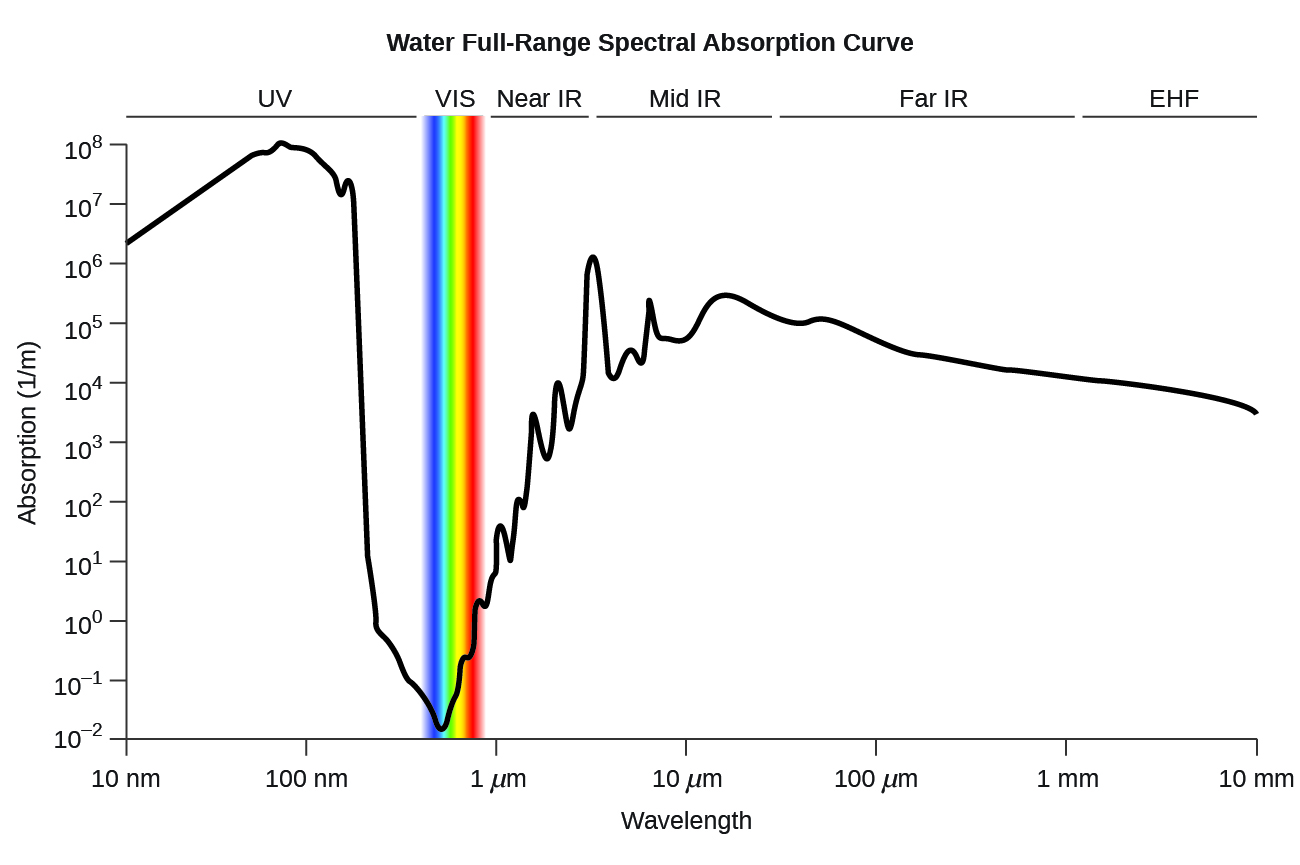
Water full-range spectral absorption curve. This curve shows the full-range spectral absorption for water. The
y -axis signifies the absorption in 1/cm. If we divide 1 by this value, we will obtain the length of the path (in cm) after which the intensity of a light beam passing through water decays by a factor of the base of the natural logarithm e (e = 2.718281828).
Questions & Answers
the study of the heat energy which is associated with chemical reactions
Kaddija
How was CH4 and o2 was able to produce (Co2)and (H2o
First twenty elements with their valences
what is the best way to define periodic table for jamb
what is the change of matter from one state to another
what is isolation of organic compounds
Read Chapter 6, section 5
Dr
Read Chapter 6, section 5
Kareem
Atomic radius is the radius of the atom and is also called the orbital radius
Kareem
atomic radius is the distance between the nucleus of an atom and its valence shell
Amos
Read Chapter 6, section 5
paulino
Bohr's model of the theory atom
when a gas is compressed why it becomes hot?
ATOMIC
It has no oxygen then
Goldyei
read the chapter on thermochemistry...the sections on "PV" work and the First Law of Thermodynamics should help..
Dr
Which element react with water
an increase in the pressure of a gas results in the decrease of its
definition of the periodic table
what were atoms composed of?
what is chemistry
Damilola
Source:
OpenStax, Chemistry. OpenStax CNX. May 20, 2015 Download for free at http://legacy.cnx.org/content/col11760/1.9
Google Play and the Google Play logo are trademarks of Google Inc.