<< Chapter < Page
  Chemistry   Page 1 / 1
Chapter >> Page >
Water Density (kg/m 3 ) at Different Temperatures (°C)
Temperature Data for t<0 °C are for supercooled water Density
0 999.8395
4 999.9720 (density maximum)
10 999.7026
15 999.1026
20 998.2071
22 997.7735
25 997.0479
30 995.6502
40 992.2
60 983.2
80 971.8
100 958.4
A line graph is titled “Density of Water as a Function of Temperature.” The x-axis is titled “Temperature, degrees Celsius,” and the y-axis is titled “Density, Kilograms per cubic meter.” A line connects plot points at the coordinates 0 and 999.8395, 4 and 999.9720, 10 and 999.7026, 15 and 999.1026, 20 and 998.2071, 22 and 997.7735, 25 and 997.0479, 30 and 995.6502, 40 and 992.2, 60 and 983.2, 80 and 971.8, and 100 and 958.4.
Water Vapor Pressure at Different Temperatures (°C)
Temperature Vapor Pressure (torr) Vapor Pressure (Pa)
0 4.6 613.2812
4 6.1 813.2642
10 9.2 1226.562
15 12.8 1706.522
20 17.5 2333.135
22 19.8 2639.776
25 23.8 3173.064
30 31.8 4239.64
35 42.2 5626.188
40 55.3 7372.707
45 71.9 9585.852
50 92.5 12332.29
55 118.0 15732
60 149.4 19918.31
65 187.5 24997.88
70 233.7 31157.35
75 289.1 38543.39
80 355.1 47342.64
85 433.6 57808.42
90 525.8 70100.71
95 633.9 84512.82
100 760.0 101324.7
A line graph is titled “Vapor Pressure as a Function of Temperature.” The x-axis is titled “Temperature, degrees Celsius,” and the y-axis is titled “Vapor pressure, torr.” A line connects plot points at the coordinates 0 and 4.6, 4 and 6.1, 10 and 9.2, 15 and 12.8, 20 and 17.5, 22 and 19.8, 25 and 23.8, 30 and 31.8, 35 and 42.2, 40 and 55.3, 45 and 71.9, 50 and 92.5, 55 and 118.0, 60 and 149.4, 65 and 187.5, 70 and 233.7, 75 and 289.1, 80 and 355.1, 85 and 433.6, 90 and 525.8, 95 and 633.9, and 100 and 760.0.
Water K w and pK w at Different Temperatures (°C)
Temperature K w 10 –14 pK w pK w = –log 10 (K w )
0 0.112 14.95
5 0.182 14.74
10 0.288 14.54
15 0.465 14.33
20 0.671 14.17
25 0.991 14.00
30 1.432 13.84
35 2.042 13.69
40 2.851 13.55
45 3.917 13.41
50 5.297 13.28
55 7.080 13.15
60 9.311 13.03
75 19.95 12.70
100 56.23 12.25
A line graph is titled “Water pK subscript W as a Function of Temperature.” The x-axis is titled “Temperature, degrees Celsius,” and the y-axis is titled “pK subscript W.” A line connects plot points at the coordinates 0 and 14.95, 5 and 14.74, 10 and 14.54, 15 and 14.33, 20 and 14.17, 25 and 14, 30 and 13.84, 35 and 13.69, 40 and 13.55, 45 and 13.41, 50 and 13.28, 55 and 13.15, 60 and 13.03, 75 and 12.7, and 100 and 12.25.
Specific Heat Capacity for Water
C°(H 2 O( l )) = 4184 J∙K −1 ∙kg −1 = 4.184 J∙g -1 ∙°C -1
C°(H 2 O( s )) = 1864 J∙K −1 ∙kg −1
C°(H 2 O( g )) = 2093 J∙K −1 ∙kg −1
Standard Water Melting and Boiling Temperatures and Enthalpies of the Transitions
Temperature (K) Δ H (kJ/mol)
melting 273.15 6.088
boiling 373.15 40.656 (44.016 at 298 K)
Water Cryoscopic (Freezing Point Depression) and Ebullioscopic (Boiling Point Elevation) Constants
K f = 1.86°C∙kg∙mol −1 (cryoscopic constant)
K b = 0.51°C∙kg∙mol −1 (ebullioscopic constant)
A line graph is titled “Water Full-Range Spectral Absorption Curve.” The x-axis is titled “Wavelength” and the y-axis is titled “Absorption ( 1 per meter ).” Evenly spaced tick marks on the x-axis denote 10 nanometers, 100 nanometers, 1 micrometer, 10 micrometers, 100 micrometers, 1 millimeter, and 10 millimeters. Evenly spaced tick marks on the y-axis denote 10 superscript negative two, 10 superscript negative one, 10 superscript zero, 10 superscript one, 10 superscript two, 10 superscript three, 10 superscript four, 10 superscript five, 10 superscript six, 10 superscript seven, and 10 superscript eight. Above the graph, horizontal lines indicate the range of wavelengths for U V, V I S, near I R , mid I R , far I R , and E H F. The graph contains one line that begins at 10 nanometers and a little more than 10 superscript six. Moving from left to right, this line ascends gradually until it reaches a point near 100 nanometers and 10 superscript eight. From this point, the line steeply descends to a point a little more than halfway between 100 nanometers and 1 micrometer, and slightly more than 10 superscript two. This point indicates the end of the range labeled “U V” and the beginning of the range labeled “V I S.” The range labeled “V I S” is shaded with a color spectrum including the full range of Roy G Biv colors. Here, the line briefly descends in the same path as before, and then steeply ascends to a point near 1 micrometer and 10 superscript zero. This point indicates the end of the range labeled “V I S” and the beginning of the range labeled “near I R.” The line continues its steep ascent, with short, abrupt descents in between, until it reaches a point a little more than halfway between 1 micrometer and 10 micrometers, and a little more than 10 superscript six. This point indicates the end of the range labeled “near I R” and the beginning of the range labeled “mid I R.” Here, the line moves steeply and sporadically up and down until it reaches a point a little more than halfway between 10 micrometers and 100 micrometers, and slightly more than 10 superscript five. This point indicates the end of the range labeled “Mid I R” and the beginning of the range labeled “Far I R.” The line descends very gradually to a point slightly more than 1 millimeter and slightly more than 10 superscript four. This point indicates the end of the range labeled “Far I R” and the beginning of the range labeled “E H F.” The line continues its gradual descent to 10 millimeters and slightly more than 10 superscript three. This point indicates the end of the range labeled “E H F.”
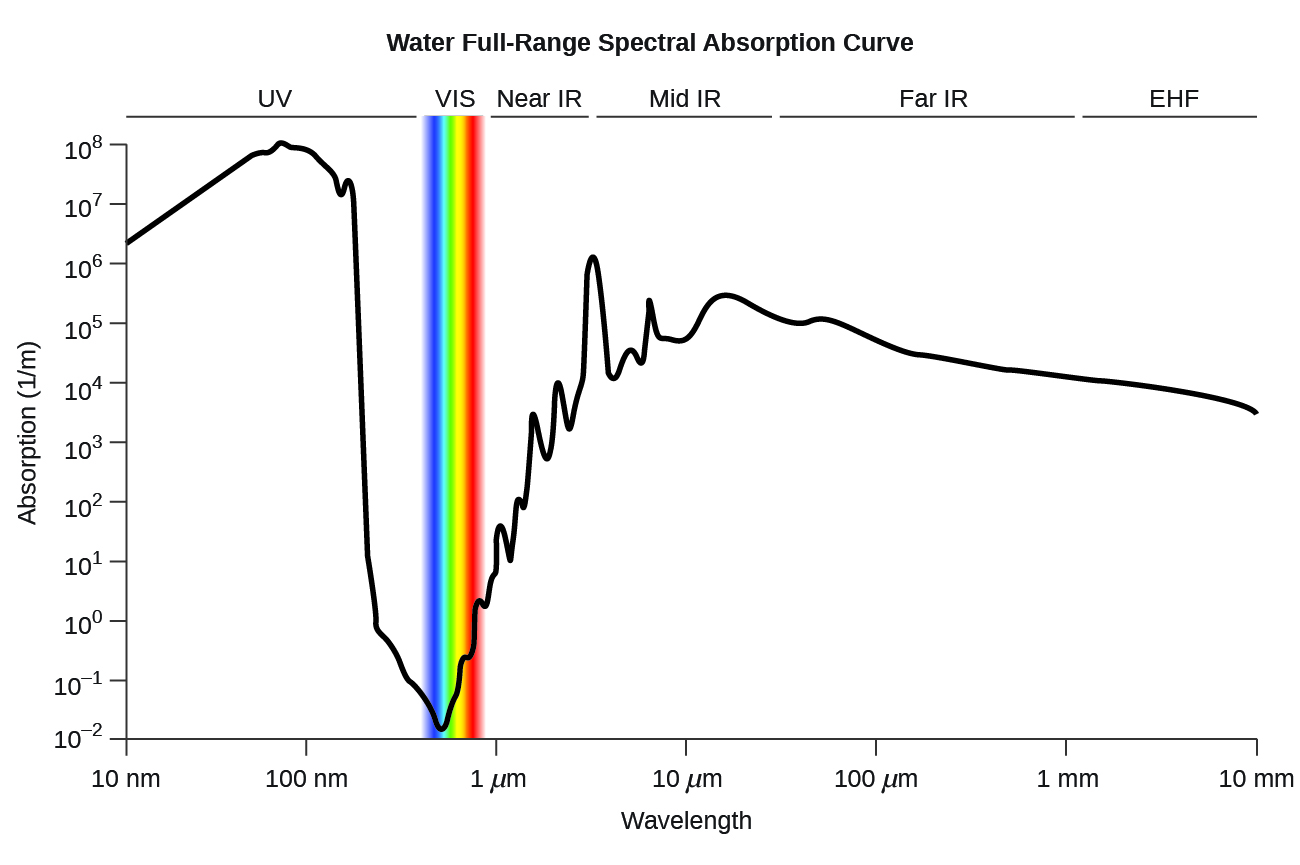
Water full-range spectral absorption curve. This curve shows the full-range spectral absorption for water. The y -axis signifies the absorption in 1/cm. If we divide 1 by this value, we will obtain the length of the path (in cm) after which the intensity of a light beam passing through water decays by a factor of the base of the natural logarithm e (e = 2.718281828).

Questions & Answers

it is the relatively stable flow of income
Chidubem Reply
what is circular flow of income
Divine Reply
branches of macroeconomics
SHEDRACK Reply
what is Flexible exchang rate?
poudel Reply
is gdp a reliable measurement of wealth
Atega Reply
introduction to econometrics
Husseini Reply
Hi
mostafa
hi
LEMLEM
hello
Sammol
hi
Mahesh
bi
Ruqayat
hi
Ruqayat
Hi fellas
Nyawa
hey
Sammol
hi
God
hello
Jahara
Good morning
Jorge
hi
abubakar
hi
Nmesoma
hi
Mahesh
Hi
Tom
Why is unemployment rate never zero at full employment?
Priyanka Reply
bcoz of existence of frictional unemployment in our economy.
Umashankar
what is flexible exchang rate?
poudel
due to existence of the pple with disabilities
Abdulraufu
the demand of a good rises, causing the demand for another good to fall
Rushawn Reply
is it possible to leave every good at the same level
Joseph
I don't think so. because check it, if the demand for chicken increases, people will no longer consume fish like they used to causing a fall in the demand for fish
Anuolu
is not really possible to let the value of a goods to be same at the same time.....
Salome
Suppose the inflation rate is 6%, does it mean that all the goods you purchase will cost 6% more than previous year? Provide with reasoning.
Geetha Reply
Not necessarily. To measure the inflation rate economists normally use an averaged price index of a basket of certain goods. So if you purchase goods included in the basket, you will notice that you pay 6% more, otherwise not necessarily.
Waeth
discus major problems of macroeconomics
Alii Reply
what is the problem of macroeconomics
Yoal
Economic growth Stable prices and low unemployment
Ephraim
explain inflationcause and itis degre
Miresa Reply
what is inflation
Getu
increase in general price levels
WEETO
Good day How do I calculate this question: C= 100+5yd G= 2000 T= 2000 I(planned)=200. Suppose the actual output is 3000. What is the level of planned expenditures at this level of output?
Chisomo Reply
how to calculate actual output?
Chisomo
how to calculate the equilibrium income
Beshir
Criteria for determining money supply
Thapase Reply
who we can define macroeconomics in one line
Muhammad
Aggregate demand
Mohammed
C=k100 +9y and i=k50.calculate the equilibrium level of output
Mercy Reply
Hi
Isiaka
Hi
Geli
hy
Man
👋
Bahunda
hy how are you?
Man
ys
Amisha
how are you guys
Sekou
f9 guys
Amisha
how are you guys
Sekou
ys am also fine
Amisha
fine and you guys
Geli
from Nepal
Amisha
nawalparasi district from belatari
Amisha
nd u
Amisha
I am Camara from Guinea west Africa... happy to meet you guys here
Sekou
ma management ho
Amisha
ahile becheclor ho
Amisha
hjr ktm bta ho ani k kaam grnu hunxa tw
Amisha
belatari
Amisha
1st year ho
Amisha
nd u
Amisha
ahh
Amisha
kaha biratnagar
Amisha
ys
Amisha
kina k vo
Amisha
money as unit of account means what?
Kalombe
A unit of account is something that can be used to value goods and services and make calculations
Jim
all of you please speak in English I can't understand you're language
Muhammad
I want to know how can we define macroeconomics in one line
Muhammad
it must be .9 or 0.9 no Mpc is greater than 1 Y=100+.9Y+50 Y-.9Y=150 0.1Y/0.1=150/0.1 Y=1500
Kalombe
Mercy is it clear?😋
Kalombe
hi can someone help me on this question If a negative shocks shifts the IS curve to the left, what type of policy do you suggest so as to stabilize the level of output? discuss your answer using appropriate graph.
Galge Reply
if interest rate is increased this will will reduce the level of income shifting the curve to the left ◀️
Kalombe
Got questions? Join the online conversation and get instant answers!
Jobilize.com Reply

Get Jobilize Job Search Mobile App in your pocket Now!

Get it on Google Play Download on the App Store Now


Source:  OpenStax, Chemistry. OpenStax CNX. May 20, 2015 Download for free at http://legacy.cnx.org/content/col11760/1.9
Google Play and the Google Play logo are trademarks of Google Inc.

Notification Switch

Would you like to follow the 'Chemistry' conversation and receive update notifications?

Ask