Home
Chemistry
Chemistry
Water properties
Water Density (kg/m
3 ) at Different Temperatures (°C)
Temperature
Density
0
999.8395
4
999.9720 (density maximum)
10
999.7026
15
999.1026
20
998.2071
22
997.7735
25
997.0479
30
995.6502
40
992.2
60
983.2
80
971.8
100
958.4
Water Vapor Pressure at Different Temperatures (°C)
Temperature
Vapor Pressure (torr)
Vapor Pressure (Pa)
0
4.6
613.2812
4
6.1
813.2642
10
9.2
1226.562
15
12.8
1706.522
20
17.5
2333.135
22
19.8
2639.776
25
23.8
3173.064
30
31.8
4239.64
35
42.2
5626.188
40
55.3
7372.707
45
71.9
9585.852
50
92.5
12332.29
55
118.0
15732
60
149.4
19918.31
65
187.5
24997.88
70
233.7
31157.35
75
289.1
38543.39
80
355.1
47342.64
85
433.6
57808.42
90
525.8
70100.71
95
633.9
84512.82
100
760.0
101324.7
Water K
w and pK
w at Different Temperatures (°C)
Temperature
K
w 10
–14
pK
w
0
0.112
14.95
5
0.182
14.74
10
0.288
14.54
15
0.465
14.33
20
0.671
14.17
25
0.991
14.00
30
1.432
13.84
35
2.042
13.69
40
2.851
13.55
45
3.917
13.41
50
5.297
13.28
55
7.080
13.15
60
9.311
13.03
75
19.95
12.70
100
56.23
12.25
Specific Heat Capacity for Water
C°(H
2 O(
l )) = 4184 J∙K
−1 ∙kg
−1 = 4.184 J∙g
-1 ∙°C
-1
C°(H
2 O(
s )) = 1864 J∙K
−1 ∙kg
−1
C°(H
2 O(
g )) = 2093 J∙K
−1 ∙kg
−1
Standard Water Melting and Boiling Temperatures and Enthalpies of the Transitions
Temperature (K)
Δ
H (kJ/mol)
melting
273.15
6.088
boiling
373.15
40.656 (44.016 at 298 K)
Water Cryoscopic (Freezing Point Depression) and Ebullioscopic (Boiling Point Elevation) Constants
K
f = 1.86°C∙kg∙mol
−1 (cryoscopic constant)
K
b = 0.51°C∙kg∙mol
−1 (ebullioscopic constant)
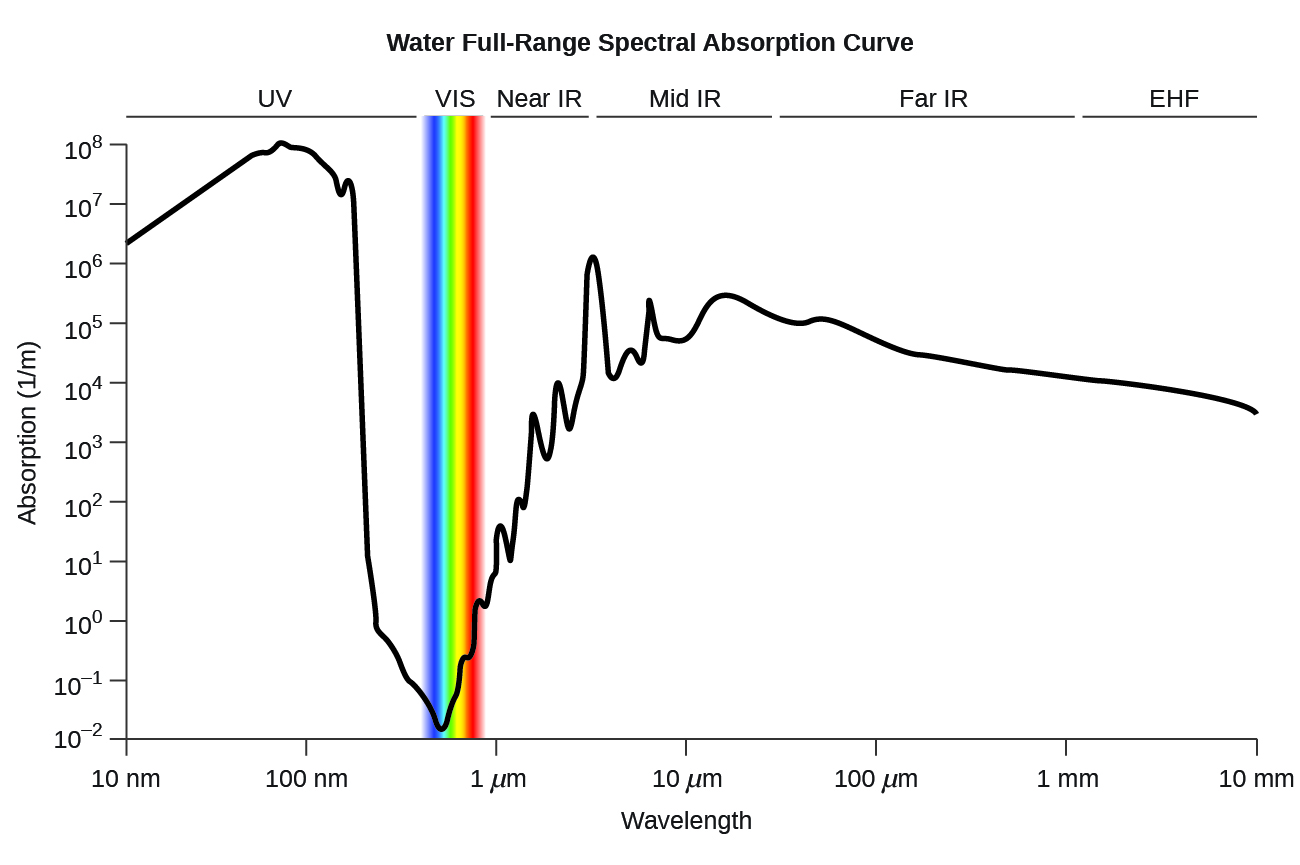
Water full-range spectral absorption curve. This curve shows the full-range spectral absorption for water. The
y -axis signifies the absorption in 1/cm. If we divide 1 by this value, we will obtain the length of the path (in cm) after which the intensity of a light beam passing through water decays by a factor of the base of the natural logarithm e (e = 2.718281828).
Questions & Answers
Ayele, K., 2003. Introductory Economics, 3rd ed., Addis Ababa.
can you send the book attached ?
Ariel
the study of how humans make choices under conditions of scarcity
AI-Robot
U(x,y) = (x×y)1/2
find mu of x for y
U(x,y) = (xÃy)1/2
find mu of x for y
Desalegn
this is the study of how the society manages it's scarce resources
Belonwu
macroeconomic is the branch of economics which studies actions, scale, activities and behaviour of the aggregate economy as a whole.
husaini
difference between firm and industry
what's the difference between a firm and an industry
Abdul
firm is the unit which transform inputs to output where as industry contain combination of firms with similar production 😅😅
Abdulraufu
Suppose the demand function that a firm faces shifted from
Qd 120 3P
to
Qd 90 3P
and the supply function has shifted from
QS
20 2P
to
QS
10 2P .
a) Find the effect of this change on price and quantity.
b) Which of the changes in demand and supply is higher?
explain standard reason why economic is a science
factors influencing supply
scares
means__________________ends
resources. unlimited
Jan
economics is a science that studies human behaviour as a relationship b/w ends and scares means which have alternative uses
Jan
calculate the profit maximizing for demand and supply
Why qualify 28 supplies
Milan
out-of-pocket costs for a firm, for example, payments for wages and salaries, rent, or materials
AI-Robot
concepts of supply in microeconomics
identify a demand and a supply curve
there's a difference
Aryan
Demand curve shows that how supply and others conditions affect on demand of a particular thing and what percent demand increase whith increase of supply of goods
Israr
Hi Sir please how do u calculate Cross elastic demand and income elastic demand?
Abari
Got questions? Join the online conversation and get instant answers!
Source:
OpenStax, Chemistry. OpenStax CNX. May 20, 2015 Download for free at http://legacy.cnx.org/content/col11760/1.9
Google Play and the Google Play logo are trademarks of Google Inc.