

| << Chapter < Page | Chapter >> Page > |
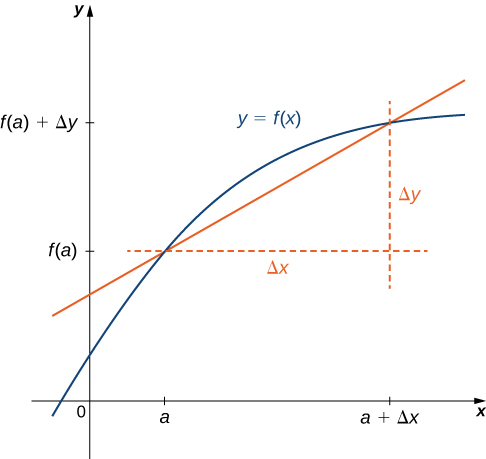
In place of we may also use Use of the notation (called Leibniz notation) is quite common in engineering and physics. To understand this notation better, recall that the derivative of a function at a point is the limit of the slopes of secant lines as the secant lines approach the tangent line. The slopes of these secant lines are often expressed in the form where is the difference in the values corresponding to the difference in the values, which are expressed as ( [link] ). Thus the derivative, which can be thought of as the instantaneous rate of change of with respect to is expressed as
We have already discussed how to graph a function, so given the equation of a function or the equation of a derivative function, we could graph it. Given both, we would expect to see a correspondence between the graphs of these two functions, since gives the rate of change of a function (or slope of the tangent line to
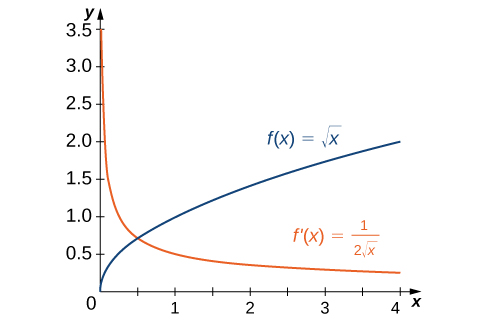
In [link] we found that for If we graph these functions on the same axes, as in [link] , we can use the graphs to understand the relationship between these two functions. First, we notice that is increasing over its entire domain, which means that the slopes of its tangent lines at all points are positive. Consequently, we expect for all values of in its domain. Furthermore, as increases, the slopes of the tangent lines to are decreasing and we expect to see a corresponding decrease in We also observe that is undefined and that corresponding to a vertical tangent to at
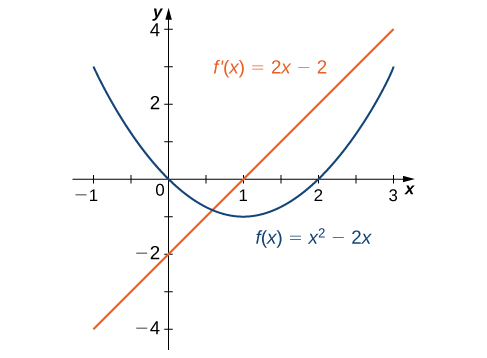
In [link] we found that for The graphs of these functions are shown in [link] . Observe that is decreasing for For these same values of For values of is increasing and Also, has a horizontal tangent at and
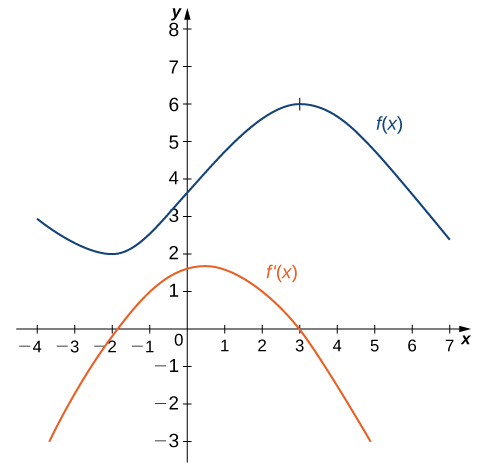
Use the following graph of to sketch a graph of
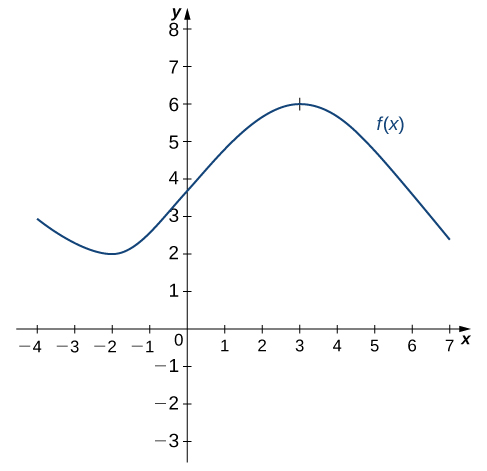
The solution is shown in the following graph. Observe that is increasing and on Also, is decreasing and on and on Also note that has horizontal tangents at and and and
Sketch the graph of On what interval is the graph of above the -axis?
Now that we can graph a derivative, let’s examine the behavior of the graphs. First, we consider the relationship between differentiability and continuity. We will see that if a function is differentiable at a point, it must be continuous there; however, a function that is continuous at a point need not be differentiable at that point. In fact, a function may be continuous at a point and fail to be differentiable at the point for one of several reasons.
Notification Switch
Would you like to follow the 'Calculus volume 1' conversation and receive update notifications?

|
|

|
|

|
|

|
|

|
|
|
|
|

|
|

|
|

|
|

|