<< Chapter < Page Chapter >> Page >
  • Determine the area of a region between two curves by integrating with respect to the independent variable.
  • Find the area of a compound region.
  • Determine the area of a region between two curves by integrating with respect to the dependent variable.

In Introduction to Integration , we developed the concept of the definite integral to calculate the area below a curve on a given interval. In this section, we expand that idea to calculate the area of more complex regions. We start by finding the area between two curves that are functions of x , beginning with the simple case in which one function value is always greater than the other. We then look at cases when the graphs of the functions cross. Last, we consider how to calculate the area between two curves that are functions of
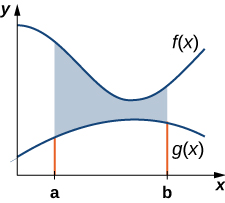
 y .

Area of a region between two curves

Let f ( x ) and g ( x ) be continuous functions over an interval [ a , b ] such that f ( x ) g ( x ) on [ a , b ] . We want to find the area between the graphs of the functions, as shown in the following figure.

This figure is a graph in the first quadrant. There are two curves on the graph. The higher curve is labeled “f(x)” and the lower curve is labeled “g(x)”. There are two boundaries on the x-axis labeled a and b. There is shaded area between the two curves bounded by lines at x=a and x=b.
The area between the graphs of two functions, f ( x ) and g ( x ) , on the interval [ a , b ] .

As we did before, we are going to partition the interval on the x -axis and approximate the area between the graphs of the functions with rectangles. So, for i = 0 , 1 , 2 ,… , n , let P = { x i } be a regular partition of [ a , b ] . Then, for i = 1 , 2 ,… , n , choose a point x i * [ x i 1 , x i ] , and on each interval [ x i 1 , x i ] construct a rectangle that extends vertically from g ( x i * ) to f ( x i * ) . [link] (a) shows the rectangles when x i * is selected to be the left endpoint of the interval and n = 10 . [link] (b) shows a representative rectangle in detail.

Use this calculator to learn more about the areas between two curves.

This figure has three graphs. The first graph has two curves, one over the other. In between the curves is a rectangle. The top of the rectangle is on the upper curve labeled “f(x*)” and the bottom of the rectangle is on the lower curve and labeled “g(x*)”. The second graph, labeled “(a)”, has two curves on the graph. The higher curve is labeled “f(x)” and the lower curve is labeled “g(x)”. There are two boundaries on the x-axis labeled a and b. There is shaded area between the two curves bounded by lines at x=a and x=b. The third graph, labeled “(b)” has two curves one over the other. The first curve is labeled “f(x*)” and the lower curve is labeled “g(x*)”. There is a shaded rectangle between the two. The width of the rectangle is labeled as “delta x”.
(a)We can approximate the area between the graphs of two functions, f ( x ) and g ( x ) , with rectangles. (b) The area of a typical rectangle goes from one curve to the other.

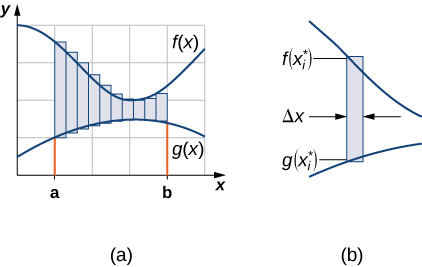
The height of each individual rectangle is f ( x i * ) g ( x i * ) and the width of each rectangle is Δ x . Adding the areas of all the rectangles, we see that the area between the curves is approximated by

A i = 1 n [ f ( x i * ) g ( x i * ) ] Δ x .

This is a Riemann sum, so we take the limit as n and we get

A = lim n i = 1 n [ f ( x i * ) g ( x i * ) ] Δ x = a b [ f ( x ) g ( x ) ] d x .

These findings are summarized in the following theorem.

Finding the area between two curves

Let f ( x ) and g ( x ) be continuous functions such that f ( x ) g ( x ) over an interval [ a , b ] . Let R denote the region bounded above by the graph of f ( x ) , below by the graph of g ( x ) , and on the left and right by the lines x = a and x = b , respectively. Then, the area of R is given by

A = a b [ f ( x ) g ( x ) ] d x .

We apply this theorem in the following example.

Finding the area of a region between two curves 1

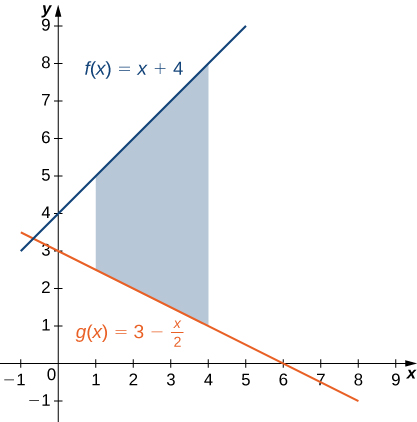
If R is the region bounded above by the graph of the function f ( x ) = x + 4 and below by the graph of the function g ( x ) = 3 x 2 over the interval [ 1 , 4 ] , find the area of region R .

The region is depicted in the following figure.

This figure is has two linear graphs in the first quadrant. They are the functions f(x) = x+4 and g(x)= 3-x/2. In between these lines is a shaded region, bounded above by f(x) and below by g(x). The shaded area is between x=1 and x=4.
A region between two curves is shown where one curve is always greater than the other.

We have

A = a b [ f ( x ) g ( x ) ] d x = 1 4 [ ( x + 4 ) ( 3 x 2 ) ] d x = 1 4 [ 3 x 2 + 1 ] d x = [ 3 x 2 4 + x ] | 1 4 = ( 16 7 4 ) = 57 4 .

The area of the region is 57 4 units 2 .

Got questions? Get instant answers now!

Questions & Answers

if three forces F1.f2 .f3 act at a point on a Cartesian plane in the daigram .....so if the question says write down the x and y components ..... I really don't understand
Syamthanda Reply
hey , can you please explain oxidation reaction & redox ?
Boitumelo Reply
hey , can you please explain oxidation reaction and redox ?
Boitumelo
for grade 12 or grade 11?
Sibulele
the value of V1 and V2
Tumelo Reply
advantages of electrons in a circuit
Rethabile Reply
we're do you find electromagnetism past papers
Ntombifuthi
what a normal force
Tholulwazi Reply
it is the force or component of the force that the surface exert on an object incontact with it and which acts perpendicular to the surface
Sihle
what is physics?
Petrus Reply
what is the half reaction of Potassium and chlorine
Anna Reply
how to calculate coefficient of static friction
Lisa Reply
how to calculate static friction
Lisa
How to calculate a current
Tumelo
how to calculate the magnitude of horizontal component of the applied force
Mogano
How to calculate force
Monambi
a structure of a thermocouple used to measure inner temperature
Anna Reply
a fixed gas of a mass is held at standard pressure temperature of 15 degrees Celsius .Calculate the temperature of the gas in Celsius if the pressure is changed to 2×10 to the power 4
Amahle Reply
How is energy being used in bonding?
Raymond Reply
what is acceleration
Syamthanda Reply
a rate of change in velocity of an object whith respect to time
Khuthadzo
how can we find the moment of torque of a circular object
Kidist
Acceleration is a rate of change in velocity.
Justice
t =r×f
Khuthadzo
how to calculate tension by substitution
Precious Reply
hi
Shongi
hi
Leago
use fnet method. how many obects are being calculated ?
Khuthadzo
khuthadzo hii
Hulisani
how to calculate acceleration and tension force
Lungile Reply
you use Fnet equals ma , newtoms second law formula
Masego
please help me with vectors in two dimensions
Mulaudzi Reply
how to calculate normal force
Mulaudzi
Got questions? Join the online conversation and get instant answers!
Jobilize.com Reply

Get Jobilize Job Search Mobile App in your pocket Now!

Get it on Google Play Download on the App Store Now


Source:  OpenStax, Calculus volume 1. OpenStax CNX. Feb 05, 2016 Download for free at http://cnx.org/content/col11964/1.2
Google Play and the Google Play logo are trademarks of Google Inc.

Notification Switch

Would you like to follow the 'Calculus volume 1' conversation and receive update notifications?

Ask