| << Chapter < Page | Chapter >> Page > |
For the following exercises, the given limit represents the derivative of a function at Find and
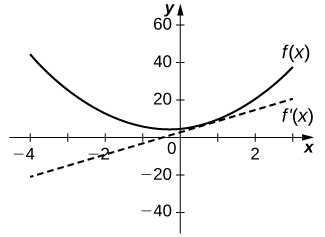
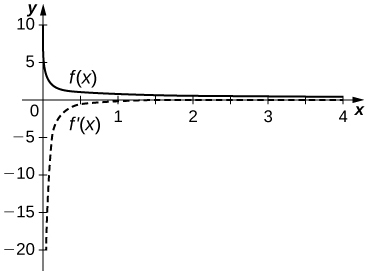
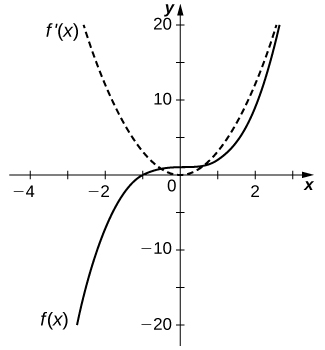
For the following functions,
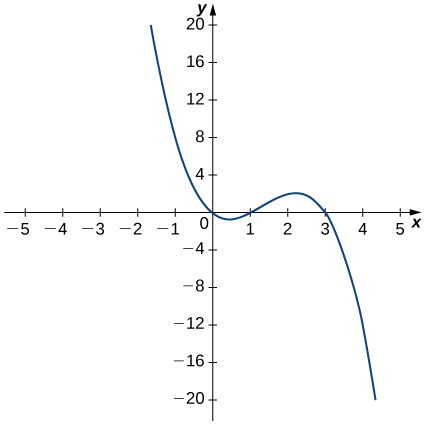
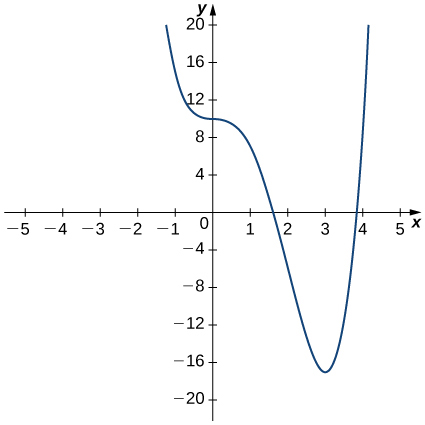
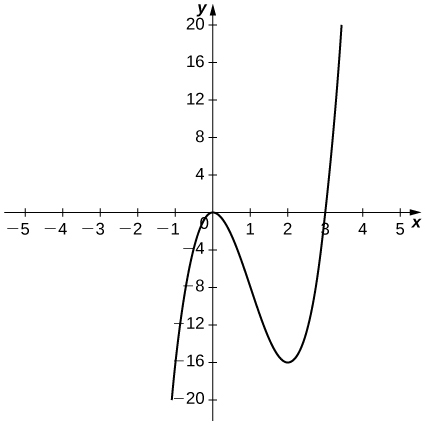
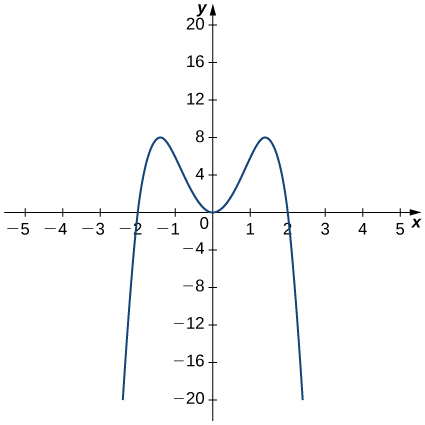
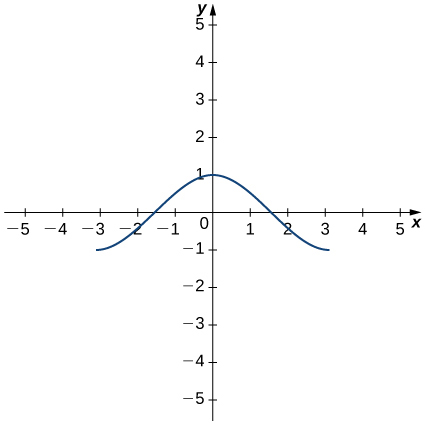
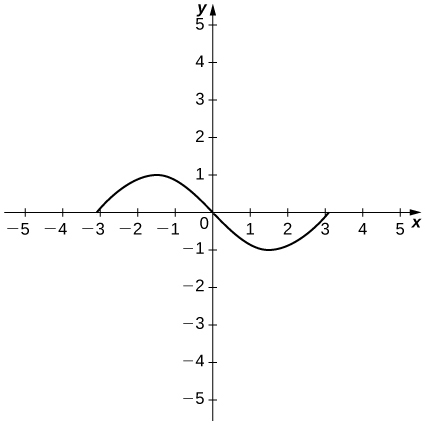
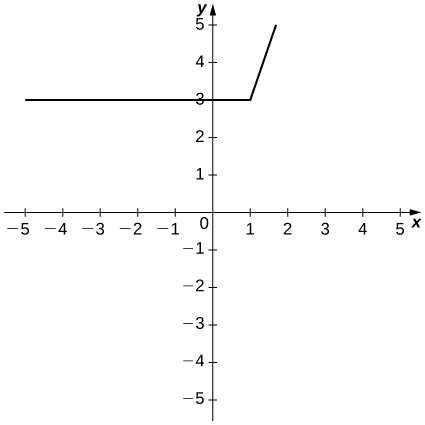
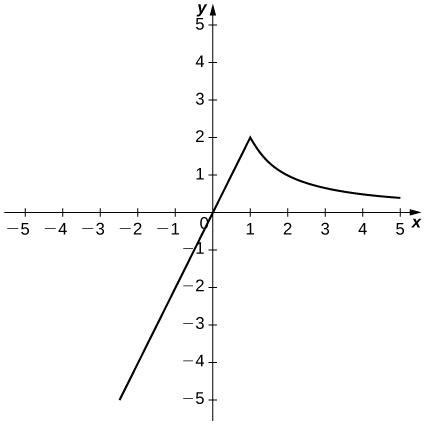
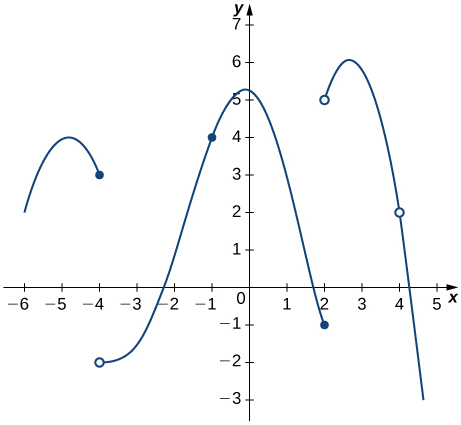
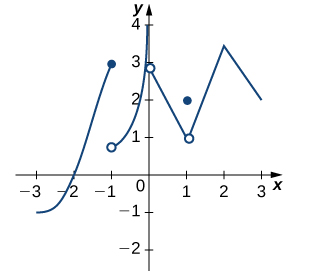
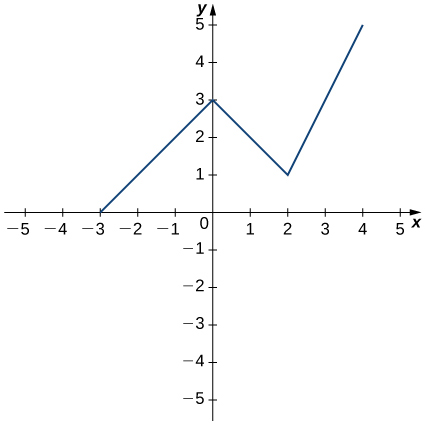
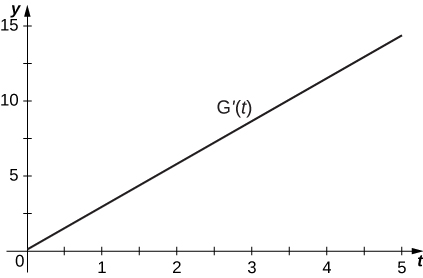
For the following graphs,
Use the graph to evaluate a. b. c. d. and e. if it exists.
For the following functions, use to find
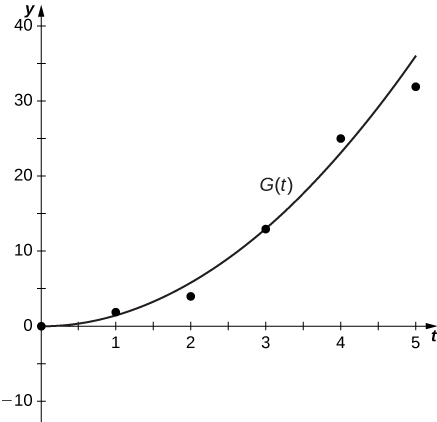
For the following exercises, use a calculator to graph Determine the function then use a calculator to graph
For the following exercises, describe what the two expressions represent in terms of each of the given situations. Be sure to include units.
denotes the population of a city at time in years.
denotes the total amount of money (in thousands of dollars) spent on concessions by customers at an amusement park.
a. Average rate at which customers spent on concessions in thousands per customer. b. Rate (in thousands per customer) at which customers spent money on concessions in thousands per customer.
denotes the total cost (in thousands of dollars) of manufacturing clock radios.
denotes the grade (in percentage points) received on a test, given hours of studying.
a. Average grade received on the test with an average study time between two values. b. Rate (in percentage points per hour) at which the grade on the test increased or decreased for a given average study time of hours.
denotes the cost (in dollars) of a sociology textbook at university bookstores in the United States in years since
denotes atmospheric pressure at an altitude of feet.
a. Average change of atmospheric pressure between two different altitudes. b. Rate (torr per foot) at which atmospheric pressure is increasing or decreasing at feet.
Sketch the graph of a function with all of the following properties:
Suppose temperature in degrees Fahrenheit at a height in feet above the ground is given by
a. The rate (in degrees per foot) at which temperature is increasing or decreasing for a given height b. The rate of change of temperature as altitude changes at feet is degrees per foot.
Suppose the total profit of a company is thousand dollars when units of an item are sold.
The graph in the following figure models the number of people who have come down with the flu weeks after its initial outbreak in a town with a population of citizens.
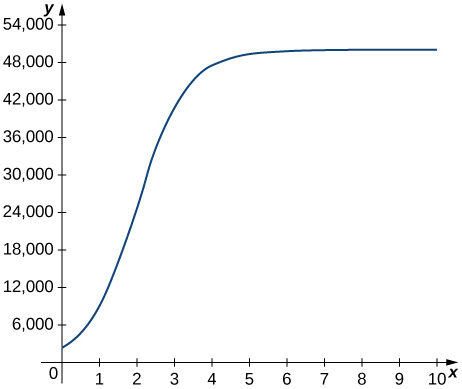
a. The rate at which the number of people who have come down with the flu is changing weeks after the initial outbreak. b. The rate is increasing sharply up to the third week, at which point it slows down and then becomes constant.
For the following exercises, use the following table, which shows the height of the Saturn rocket for the Apollo mission seconds after launch.
| Time (seconds) | Height (meters) |
|---|---|
What is the physical meaning of What are the units?
[T] Construct a table of values for and graph both and on the same graph. ( Hint: for interior points, estimate both the left limit and right limit and average them.)
| Time (seconds) | |
|---|---|
[T] The best linear fit to the data is given by where is the height of the rocket (in meters) and is the time elapsed since takeoff. From this equation, determine Graph with the given data and, on a separate coordinate plane, graph
[T] The best quadratic fit to the data is given by where is the height of the rocket (in meters) and is the time elapsed since takeoff. From this equation, determine Graph with the given data and, on a separate coordinate plane, graph
[T] The best cubic fit to the data is given by where is the height of the rocket (in m) and is the time elapsed since take off. From this equation, determine Graph with the given data and, on a separate coordinate plane, graph Does the linear, quadratic, or cubic function fit the data best?
Using the best linear, quadratic, and cubic fits to the data, determine what are. What are the physical meanings of and what are their units?
represent the acceleration of the rocket, with units of meters per second squared
Notification Switch
Would you like to follow the 'Calculus volume 1' conversation and receive update notifications?

|
|

|
|

|
|

|
|

|
|

|
|

|
|

|
|

|
|

|