Using correct notation, describe the limit of a function.
Use a table of values to estimate the limit of a function or to identify when the limit does not exist.
Use a graph to estimate the limit of a function or to identify when the limit does not exist.
Define one-sided limits and provide examples.
Explain the relationship between one-sided and two-sided limits.
Using correct notation, describe an infinite limit.
Define a vertical asymptote.
The concept of a limit or limiting process, essential to the understanding of calculus, has been around for thousands of years. In fact, early mathematicians used a limiting process to obtain better and better approximations of areas of circles. Yet, the formal definition of a limit—as we know and understand it today—did not appear until the late 19th century. We therefore begin our quest to understand limits, as our mathematical ancestors did, by using an intuitive approach. At the end of this chapter, armed with a conceptual understanding of limits, we examine the formal definition of a limit.
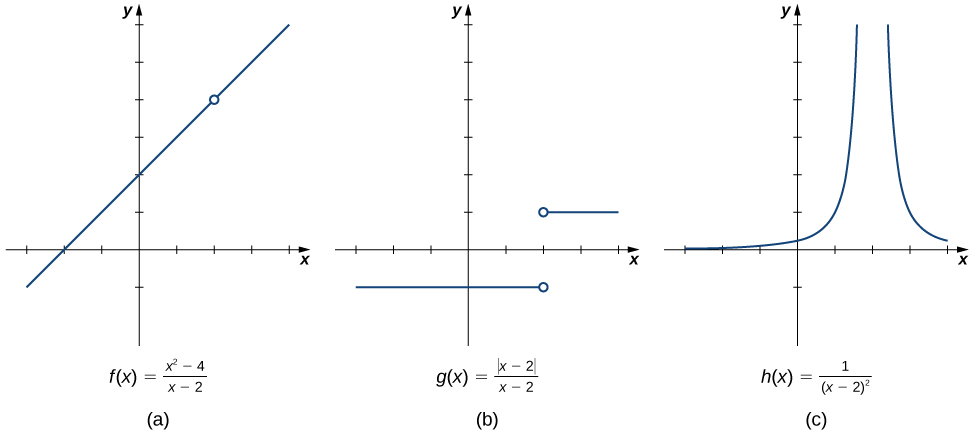
We begin our exploration of limits by taking a look at the graphs of the functions
which are shown in
[link] . In particular, let’s focus our attention on the behavior of each graph at and around
These graphs show the behavior of three different functions around
Each of the three functions is undefined at
but if we make this statement and no other, we give a very incomplete picture of how each function behaves in the vicinity of
To express the behavior of each graph in the vicinity of 2 more completely, we need to introduce the concept of a limit.
Intuitive definition of a limit
Let’s first take a closer look at how the function
behaves around
in
[link] . As the values of
x approach 2 from either side of 2, the values of
approach 4. Mathematically, we say that the limit of
as
x approaches 2 is 4. Symbolically, we express this limit as
From this very brief informal look at one limit, let’s start to develop an
intuitive definition of the limit . We can think of the limit of a function at a number
a as being the one real number
L that the functional values approach as the
x -values approach
a, provided such a real number
L exists. Stated more carefully, we have the following definition:
Definition
Let
be a function defined at all values in an open interval containing
a , with the possible exception of
a itself, and let
L be a real number. If
all values of the function
approach the real number
L as the values of
approach the number
a , then we say that the limit of
as
x approaches
a is
L . (More succinct, as
x gets closer to
a ,
gets closer and stays close to
L .) Symbolically, we express this idea as
We can estimate limits by constructing tables of functional values and by looking at their graphs. This process is described in the following Problem-Solving Strategy.
Problem-solving strategy: evaluating a limit using a table of functional values
To evaluate
we begin by completing a table of functional values. We should choose two sets of
x -values—one set of values approaching
a and less than
a , and another set of values approaching
a and greater than
a .
[link] demonstrates what your tables might look like.
Table of functional values for
x
x
Use additional values as necessary.
Use additional values as necessary.
Next, let’s look at the values in each of the
columns and determine whether the values seem to be approaching a single value as we move down each column. In our columns, we look at the sequence
and so on, and
and so on. (
Note : Although we have chosen the
x -values
and so forth, and these values will probably work nearly every time, on very rare occasions we may need to modify our choices.)
If both columns approach a common
y -value
L , we state
We can use the following strategy to confirm the result obtained from the table or as an alternative method for estimating a limit.
Using a graphing calculator or computer software that allows us graph functions, we can plot the function
making sure the functional values of
for
x -values near
a are in our window. We can use the trace feature to move along the graph of the function and watch the
y -value readout as the
x -values approach
a . If the
y -values approach
L as our
x -values approach
a from both directions, then
We may need to zoom in on our graph and repeat this process several times.
the study of living organisms and their interactions with one another and their environment.
Wine
discuss the biological phenomenon and provide pieces of evidence to show that it was responsible for the formation of eukaryotic organelles in an essay form
advantage of electronic microscope is easily and clearly while disadvantage is dangerous because its electronic. advantage of light microscope is savely and naturally by sun while disadvantage is not easily,means its not sharp and not clear
Abdullahi
cell theory state that every organisms composed of one or more cell,cell is the basic unit of life
Abdullahi
is like gone fail us
DENG
cells is the basic structure and functions of all living things
A scanning electron microscope (SEM) is ideal for situations requiring high-resolution imaging of surfaces. It is commonly used in materials science, biology, and geology to examine the topography and composition of samples at a nanoscale level. SEM is particularly useful for studying fine details,
Hilary
Got questions? Join the online conversation and get instant answers!