<< Chapter < Page Chapter >> Page >
  • Describe the tangent problem and how it led to the idea of a derivative.
  • Explain how the idea of a limit is involved in solving the tangent problem.
  • Recognize a tangent to a curve at a point as the limit of secant lines.
  • Identify instantaneous velocity as the limit of average velocity over a small time interval.
  • Describe the area problem and how it was solved by the integral.
  • Explain how the idea of a limit is involved in solving the area problem.
  • Recognize how the ideas of limit, derivative, and integral led to the studies of infinite series and multivariable calculus.

As we embark on our study of calculus, we shall see how its development arose from common solutions to practical problems in areas such as engineering physics—like the space travel problem posed in the chapter opener. Two key problems led to the initial formulation of calculus: (1) the tangent problem, or how to determine the slope of a line tangent to a curve at a point; and (2) the area problem, or how to determine the area under a curve.

The tangent problem and differential calculus

Rate of change is one of the most critical concepts in calculus. We begin our investigation of rates of change by looking at the graphs of the three lines f ( x ) = −2 x 3 , g ( x ) = 1 2 x + 1 , and h ( x ) = 2 , shown in [link] .

Three graphs of different linear functions are shown. The first is f(x) = -2x – 3, with slope of -2 and y intercept of -3. The second is g(x) = x / 2 + 1, with slope of 1/2 and y intercept of 1. The third is h(x) = 2, with slope of 0 and y intercept of 2. The rate of change of each is constant, as determined by the slope.
The rate of change of a linear function is constant in each of these three graphs, with the constant determined by the slope.

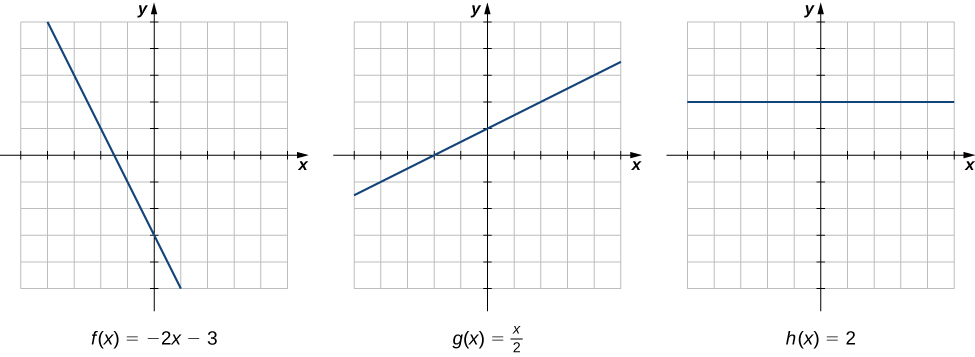
As we move from left to right along the graph of f ( x ) = −2 x 3 , we see that the graph decreases at a constant rate. For every 1 unit we move to the right along the x -axis, the y -coordinate decreases by 2 units. This rate of change is determined by the slope (−2) of the line. Similarly, the slope of 1/2 in the function g ( x ) tells us that for every change in x of 1 unit there is a corresponding change in y of 1/2 unit. The function h ( x ) = 2 has a slope of zero, indicating that the values of the function remain constant. We see that the slope of each linear function indicates the rate of change of the function.

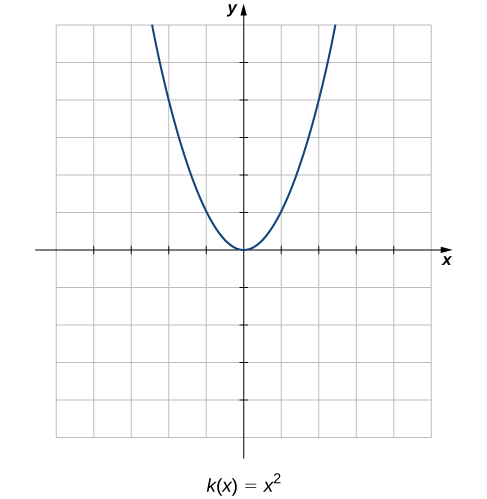
Compare the graphs of these three functions with the graph of k ( x ) = x 2 ( [link] ). The graph of k ( x ) = x 2 starts from the left by decreasing rapidly, then begins to decrease more slowly and level off, and then finally begins to increase—slowly at first, followed by an increasing rate of increase as it moves toward the right. Unlike a linear function, no single number represents the rate of change for this function. We quite naturally ask: How do we measure the rate of change of a nonlinear function?

A graph of the parabola k(x) = x^2, which opens up and has its vertex at the origin.
The function k ( x ) = x 2 does not have a constant rate of change.

We can approximate the rate of change of a function f ( x ) at a point ( a , f ( a ) ) on its graph by taking another point ( x , f ( x ) ) on the graph of f ( x ) , drawing a line through the two points, and calculating the slope of the resulting line. Such a line is called a secant    line. [link] shows a secant line to a function f ( x ) at a point ( a , f ( a ) ) .

A graph showing a generic curved function going through the points (0,0), (a, fa.), and (x, f(x)). A straight line called the secant line is drawn through the points (a, fa.), and (x, f(x)), going below the curved function between a and x and going above the curved function at values greater than x or less than a. The curved function and the secant line cross once more at some point in the third quadrant. The slope of the secant line is ( f(x) – fa. ) / (x – a).
The slope of a secant line through a point ( a , f ( a ) ) estimates the rate of change of the function at the point ( a , f ( a ) ) .

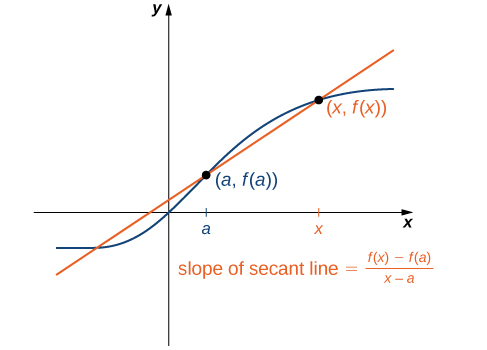
We formally define a secant line as follows:

Practice Key Terms 8

Get Jobilize Job Search Mobile App in your pocket Now!

Get it on Google Play Download on the App Store Now


Source:  OpenStax, Calculus volume 1. OpenStax CNX. Feb 05, 2016 Download for free at http://cnx.org/content/col11964/1.2
Google Play and the Google Play logo are trademarks of Google Inc.

Notification Switch

Would you like to follow the 'Calculus volume 1' conversation and receive update notifications?

Ask