When creating a table of inputs and outputs, we typically check to determine whether zero is an output. Those values of
where
are called the
zeros of a function . For example, the zeros of
are
The zeros determine where the graph of
intersects the
-axis, which gives us more information about the shape of the graph of the function. The graph of a function may never intersect the
x -axis, or it may intersect multiple (or even infinitely many) times.
Another point of interest is the
-intercept, if it exists. The
-intercept is given by
Since a function has exactly one output for each input, the graph of a function can have, at most, one
-intercept. If
is in the domain of a function
then
has exactly one
-intercept. If
is not in the domain of
then
has no
-intercept. Similarly, for any real number
if
is in the domain of
there is exactly one output
and the line
intersects the graph of
exactly once. On the other hand, if
is not in the domain of
is not defined and the line
does not intersect the graph of
This property is summarized in the
vertical line test .
Rule: vertical line test
Given a function
every vertical line that may be drawn intersects the graph of
no more than once. If any vertical line intersects a set of points more than once, the set of points does not represent a function.
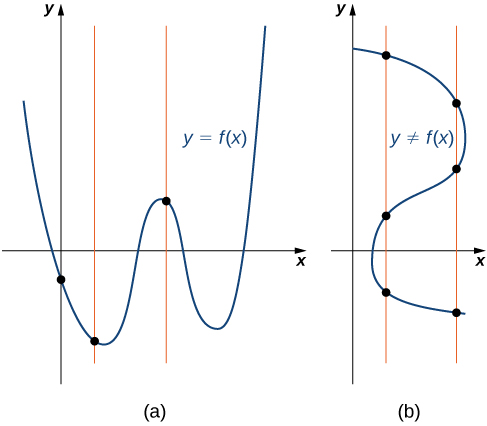
We can use this test to determine whether a set of plotted points represents the graph of a function (
[link] ).
(a) The set of plotted points represents the graph of a function because every vertical line intersects the set of points, at most, once. (b) The set of plotted points does not represent the graph of a function because some vertical lines intersect the set of points more than once.
Finding zeros and
-intercepts of a function
Consider the function
Find all zeros of
Find the
-intercept (if any).
Sketch a graph of
To find the zeros, solve
We discover that
has one zero at
The
-intercept is given by
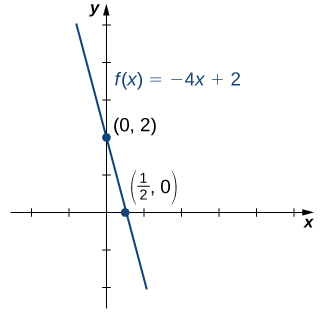
Given that
is a linear function of the form
that passes through the points
and
we can sketch the graph of
(
[link] ).
The function
is a line with
-intercept
and
-intercept
To find the zeros, solve
This equation implies
Since
for all
this equation has no solutions, and therefore
has no zeros.
The
-intercept is given by
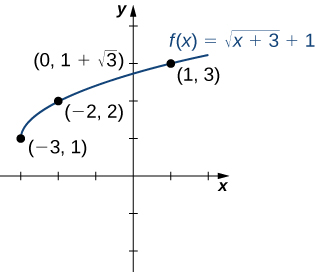
To graph this function, we make a table of values. Since we need
we need to choose values of
We choose values that make the square-root function easy to evaluate.
Making use of the table and knowing that, since the function is a square root, the graph of
should be similar to the graph of
we sketch the graph (
[link] ).
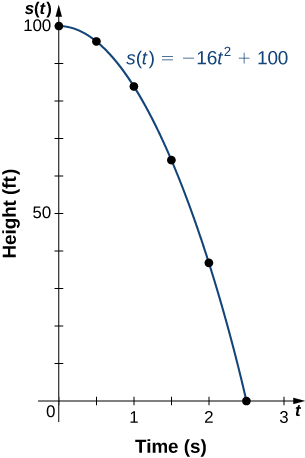
If a ball is dropped from a height of
ft, its height
at time
is given by the function
where
is measured in feet and
is measured in seconds. The domain is restricted to the interval
where
is the time when the ball is dropped and
is the time when the ball hits the ground.
Create a table showing the height
when
Using the data from the table, determine the domain for this function. That is, find the time
when the ball hits the ground.
Sketch a graph of
Height
As a function of time
Since the ball hits the ground when
the domain of this function is the interval