

| << Chapter < Page | Chapter >> Page > |
Business Fundamentals was developed by the Global Text Project, which is working to create open-content electronictextbooks that are freely available on the website http://globaltext.terry.uga.edu. Distribution is also possible viapaper, CD, DVD, and via this collaboration, through Connexions. The goal is to make textbooks available to the manywho cannot afford them. For more information on getting involved with the Global Text Project or Connexions email us atdrexel@uga.edu and dcwill@cnx.org.
Editors: George M Zinkhan, Anastasia Thyroff, Anja Rempel, and Hongbum Kim (The University of Georgia, USA)
Reviewer: Bettina Cornwell (University of Michigan, USA)
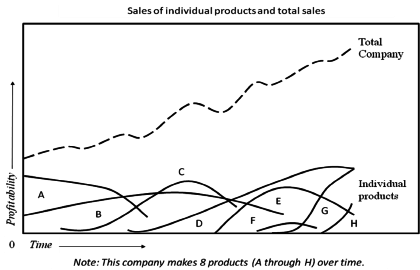
The twenty-first century marketplace is dynamic and fast changing. As a result, organizations are under pressure to evaluate their existing product line and to make continuous decisions about adding new products or deleting existing products. For instance, the graph in [link] shows how an organization must establish a series of successful products, if that organization wants to maintain a consistent stream of sales or else grow sales over time. One reason for this pattern is the product life cycle. As shown in the graph, no product lasts forever, and sales levels can fluctuate dramatically over time. The company illustrated in Exhibit 1 has marketed 8 different products over time. In the past, four of these products have been deleted (the products labeled as A, B, C, and F). As a result, the sales level in the most current period depends upon the success of the remaining four products. If the firm has a goal to increase sales in the coming years, then it is imperative for that firm to introduce a new group of successful products.
Organizations invest a lot of money to create new products that perform effectively. Nonetheless, firms often struggle to convince people to incorporate these new products into their routines (Arts 2008). For example, it took 18 years for microwave ovens to gain acceptance in Greece (Tellis, Stremersch, and Yin 2003). The ultimate success of new products depends on consumers accepting them (Arts 2008).
The term “product” refers to both goods and services. A product is anything that can be offered to a market to satisfy a want or need. There are a number of ways to classify products, and those methods are discussed later in the chapter. In this chapter, we discuss the following topics: (a) Where do innovations come from? (b) product categories; (c) Innovation through business models; (d) Evaluating innovations; (e) When innovation fails: deleting products; and (f) chapter summary. In the next two sections, we briefly discuss innovations and their origins.
Notification Switch
Would you like to follow the 'Business fundamentals' conversation and receive update notifications?

|
|

|
|

|
|

|
|

|
|

|
|

|
|

|
|

|
|

|