<< Chapter < Page Chapter >> Page >

Art connection

A flow chart shows the steps in the scientific method. In step 1, an observation is made. In step 2, a question is asked about the observation. In step 3, an answer to the question, called a hypothesis, is proposed. In step 4, a prediction is made based on the hypothesis. In step 5, an experiment is done to test the prediction. In step 6, the results are analyzed to determine whether or not the hypothesis is supported. If the hypothesis is not supported, another hypothesis is made. In either case, the results are reported.
The scientific method is a series of defined steps that include experiments and careful observation. If a hypothesis is not supported by data, a new hypothesis can be proposed.

In practice, the scientific method is not as rigid and structured as it might at first appear. Sometimes an experiment leads to conclusions that favor a change in approach; often, an experiment brings entirely new scientific questions to the puzzle. Many times, science does not operate in a linear fashion; instead, scientists continually draw inferences and make generalizations, finding patterns as their research proceeds. Scientific reasoning is more complex than the scientific method alone suggests.

Reporting scientific work

Whether scientific research is basic science or applied science, scientists must share their findings for other researchers to expand and build upon their discoveries. Communication and collaboration within and between sub disciplines of science are key to the advancement of knowledge in science. For this reason, an important aspect of a scientist’s work is disseminating results and communicating with peers. Scientists can share results by presenting them at a scientific meeting or conference, but this approach can reach only the limited few who are present. Instead, most scientists present their results in peer-reviewed articles that are published in scientific journals. Peer-reviewed articles are scientific papers that are reviewed, usually anonymously by a scientist’s colleagues, or peers. These colleagues are qualified individuals, often experts in the same research area, who judge whether or not the scientist’s work is suitable for publication. The process of peer review helps to ensure that the research described in a scientific paper or grant proposal is original, significant, logical, and thorough. Grant proposals, which are requests for research funding, are also subject to peer review. Scientists publish their work so other scientists can reproduce their experiments under similar or different conditions to expand on the findings. The experimental results must be consistent with the findings of other scientists.

There are many journals and the popular press that do not use a peer-review system. A large number of online open-access journals, journals with articles available without cost, are now available many of which use rigorous peer-review systems, but some of which do not. Results of any studies published in these forums without peer review are not reliable and should not form the basis for other scientific work. In one exception, journals may allow a researcher to cite a personal communication from another researcher about unpublished results with the cited author’s permission.

Section summary

A hypothesis is a tentative explanation for an observation. A scientific theory is a well-tested and consistently verified explanation for a set of observations or phenomena. A scientific law is a description, often in the form of a mathematical formula, of the behavior of an aspect of nature under certain circumstances. The common thread throughout scientific research is the use of the scientific method. Scientists present their results in peer-reviewed scientific papers published in scientific journals.

Art connections

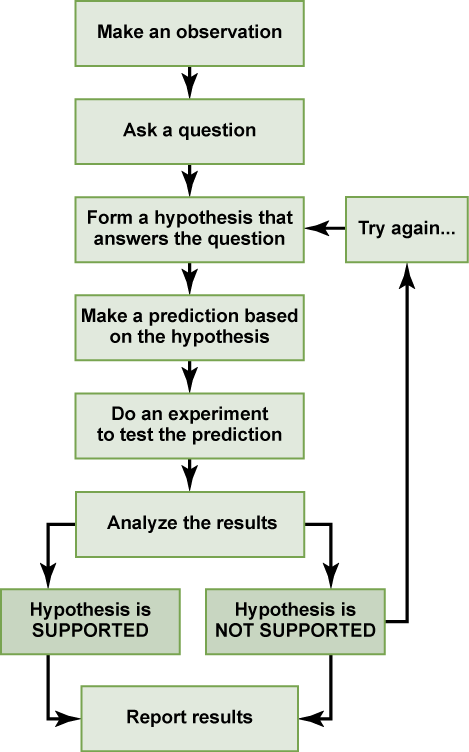
[link] In the example below, the scientific method is used to solve an everyday problem. Which part in the example below is the hypothesis? Which is the prediction? Based on the results of the experiment, is the hypothesis supported? If it is not supported, propose some alternative hypotheses.

  1. My toaster doesn’t toast my bread.
  2. Why doesn’t my toaster work?
  3. There is something wrong with the electrical outlet.
  4. If something is wrong with the outlet, my coffeemaker also won’t work when plugged into it.
  5. I plug my coffeemaker into the outlet.
  6. My coffeemaker works.

[link] The hypothesis is #3 (there is something wrong with the electrical outlet), and the prediction is #4 (if something is wrong with the outlet, then the coffeemaker also won’t work when plugged into the outlet). The original hypothesis is not supported, as the coffee maker works when plugged into the outlet. Alternative hypotheses may include (1) the toaster might be broken or (2) the toaster wasn’t turned on.

Got questions? Get instant answers now!

Questions & Answers

differentiate between demand and supply giving examples
Lambiv Reply
differentiated between demand and supply using examples
Lambiv
what is labour ?
Lambiv
how will I do?
Venny Reply
how is the graph works?I don't fully understand
Rezat Reply
information
Eliyee
devaluation
Eliyee
t
WARKISA
hi guys good evening to all
Lambiv
multiple choice question
Aster Reply
appreciation
Eliyee
explain perfect market
Lindiwe Reply
In economics, a perfect market refers to a theoretical construct where all participants have perfect information, goods are homogenous, there are no barriers to entry or exit, and prices are determined solely by supply and demand. It's an idealized model used for analysis,
Ezea
What is ceteris paribus?
Shukri Reply
other things being equal
AI-Robot
When MP₁ becomes negative, TP start to decline. Extuples Suppose that the short-run production function of certain cut-flower firm is given by: Q=4KL-0.6K2 - 0.112 • Where is quantity of cut flower produced, I is labour input and K is fixed capital input (K-5). Determine the average product of lab
Kelo
Extuples Suppose that the short-run production function of certain cut-flower firm is given by: Q=4KL-0.6K2 - 0.112 • Where is quantity of cut flower produced, I is labour input and K is fixed capital input (K-5). Determine the average product of labour (APL) and marginal product of labour (MPL)
Kelo
yes,thank you
Shukri
Can I ask you other question?
Shukri
what is monopoly mean?
Habtamu Reply
What is different between quantity demand and demand?
Shukri Reply
Quantity demanded refers to the specific amount of a good or service that consumers are willing and able to purchase at a give price and within a specific time period. Demand, on the other hand, is a broader concept that encompasses the entire relationship between price and quantity demanded
Ezea
ok
Shukri
how do you save a country economic situation when it's falling apart
Lilia Reply
what is the difference between economic growth and development
Fiker Reply
Economic growth as an increase in the production and consumption of goods and services within an economy.but Economic development as a broader concept that encompasses not only economic growth but also social & human well being.
Shukri
production function means
Jabir
What do you think is more important to focus on when considering inequality ?
Abdisa Reply
any question about economics?
Awais Reply
sir...I just want to ask one question... Define the term contract curve? if you are free please help me to find this answer 🙏
Asui
it is a curve that we get after connecting the pareto optimal combinations of two consumers after their mutually beneficial trade offs
Awais
thank you so much 👍 sir
Asui
In economics, the contract curve refers to the set of points in an Edgeworth box diagram where both parties involved in a trade cannot be made better off without making one of them worse off. It represents the Pareto efficient allocations of goods between two individuals or entities, where neither p
Cornelius
In economics, the contract curve refers to the set of points in an Edgeworth box diagram where both parties involved in a trade cannot be made better off without making one of them worse off. It represents the Pareto efficient allocations of goods between two individuals or entities,
Cornelius
Suppose a consumer consuming two commodities X and Y has The following utility function u=X0.4 Y0.6. If the price of the X and Y are 2 and 3 respectively and income Constraint is birr 50. A,Calculate quantities of x and y which maximize utility. B,Calculate value of Lagrange multiplier. C,Calculate quantities of X and Y consumed with a given price. D,alculate optimum level of output .
Feyisa Reply
Answer
Feyisa
c
Jabir
the market for lemon has 10 potential consumers, each having an individual demand curve p=101-10Qi, where p is price in dollar's per cup and Qi is the number of cups demanded per week by the i th consumer.Find the market demand curve using algebra. Draw an individual demand curve and the market dema
Gsbwnw Reply
suppose the production function is given by ( L, K)=L¼K¾.assuming capital is fixed find APL and MPL. consider the following short run production function:Q=6L²-0.4L³ a) find the value of L that maximizes output b)find the value of L that maximizes marginal product
Abdureman
types of unemployment
Yomi Reply
What is the difference between perfect competition and monopolistic competition?
Mohammed
Got questions? Join the online conversation and get instant answers!
Jobilize.com Reply

Get Jobilize Job Search Mobile App in your pocket Now!

Get it on Google Play Download on the App Store Now


Source:  OpenStax, Human biology. OpenStax CNX. Dec 01, 2015 Download for free at http://legacy.cnx.org/content/col11903/1.3
Google Play and the Google Play logo are trademarks of Google Inc.

Notification Switch

Would you like to follow the 'Human biology' conversation and receive update notifications?

Ask