<< Chapter < Page Chapter >> Page >
By the end of this section, you will be able to:
  • Describe biodiversity as the equilibrium of naturally fluctuating rates of extinction and speciation
  • Explain the legislative framework for conservation
  • Identify the factors important in conservation preserve design
  • Identify examples of the effects of habitat restoration
  • Identify the role of zoos in biodiversity conservation

Preserving biodiversity is an extraordinary challenge that must be met by greater understanding of biodiversity itself, changes in human behavior and beliefs, and various preservation strategies.

Change in biodiversity through time

The number of species on the planet, or in any geographical area, is the result of an equilibrium of two evolutionary processes that are ongoing: speciation and extinction. Both are natural “birth” and “death” processes of macroevolution. When speciation rates begin to outstrip extinction rates, the number of species will increase; likewise, the reverse is true when extinction rates begin to overtake speciation rates. Throughout the history of life on Earth, as reflected in the fossil record, these two processes have fluctuated to a greater or lesser extent, sometimes leading to dramatic changes in the number of species on the planet as reflected in the fossil record ( [link] ).

 Graph plots percent extinction occurrences versus time in millions of years before present time, starting 550 million years ago. Extinction occurrences increase and decrease in a cyclical manner. At the lowest points on the cycle, extinction occurrences were between two to five percent. Spikes in the number of extinctions occurred at the end of geological periods: end-Ordovician (450 million years ago), end-Devonian (374 million years ago), end-Permian (252 million years ago), end-Triassic (200 million years ago), and end-Cretaceous (65 million years ago). During these spikes, extinction occurrences ranged from approximately twenty-five to fifty percent.
Extinction intensity as reflected in the fossil record has fluctuated throughout Earth’s history. Sudden and dramatic losses of biodiversity, called mass extinctions, have occurred five times.

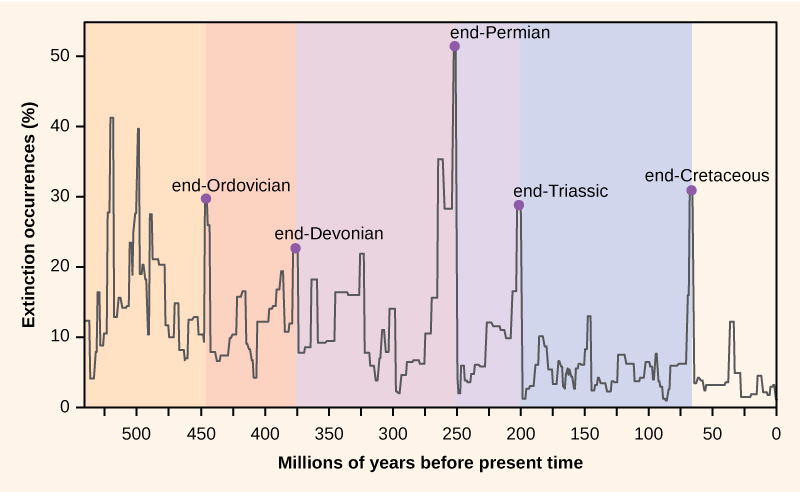
Paleontologists have identified five strata in the fossil record that appear to show sudden and dramatic (greater than half of all extant species disappearing from the fossil record) losses in biodiversity. These are called mass extinctions. There are many lesser, yet still dramatic, extinction events, but the five mass extinctions have attracted the most research into their causes. An argument can be made that the five mass extinctions are only the five most extreme events in a continuous series of large extinction events throughout the fossil record (since 542 million years ago). In most cases, the hypothesized causes are still controversial; in one, the most recent, the cause seems clear. The most recent extinction in geological time, about 65 million years ago, saw the disappearance of the dinosaurs and many other species. Most scientists now agree the cause of this extinction was the impact of a large asteroid in the present-day Yucatán Peninsula and the subsequent energy release and global climate changes caused by dust ejected into the atmosphere.

Recent and current extinction rates

A sixth, or Holocene, mass extinction has mostly to do with the activities of Homo sapiens . There are numerous recent extinctions of individual species that are recorded in human writings. Most of these are coincident with the expansion of the European colonies since the 1500s.

One of the earlier and popularly known examples is the dodo bird. The dodo bird lived in the forests of Mauritius, an island in the Indian Ocean. The dodo bird became extinct around 1662. It was hunted for its meat by sailors and was easy prey because the dodo, which did not evolve with humans, would approach people without fear. Introduced pigs, rats, and dogs brought to the island by European ships also killed dodo young and eggs ( [link] ).

Questions & Answers

it is the relatively stable flow of income
Chidubem Reply
what is circular flow of income
Divine Reply
branches of macroeconomics
SHEDRACK Reply
what is Flexible exchang rate?
poudel Reply
is gdp a reliable measurement of wealth
Atega Reply
introduction to econometrics
Husseini Reply
Hi
mostafa
hi
LEMLEM
hello
Sammol
hi
Mahesh
bi
Ruqayat
hi
Ruqayat
Hi fellas
Nyawa
hey
Sammol
hi
God
hello
Jahara
Good morning
Jorge
hi
abubakar
hi
Nmesoma
hi
Mahesh
Hi
Tom
Why is unemployment rate never zero at full employment?
Priyanka Reply
bcoz of existence of frictional unemployment in our economy.
Umashankar
what is flexible exchang rate?
poudel
due to existence of the pple with disabilities
Abdulraufu
the demand of a good rises, causing the demand for another good to fall
Rushawn Reply
is it possible to leave every good at the same level
Joseph
I don't think so. because check it, if the demand for chicken increases, people will no longer consume fish like they used to causing a fall in the demand for fish
Anuolu
is not really possible to let the value of a goods to be same at the same time.....
Salome
Suppose the inflation rate is 6%, does it mean that all the goods you purchase will cost 6% more than previous year? Provide with reasoning.
Geetha Reply
Not necessarily. To measure the inflation rate economists normally use an averaged price index of a basket of certain goods. So if you purchase goods included in the basket, you will notice that you pay 6% more, otherwise not necessarily.
Waeth
discus major problems of macroeconomics
Alii Reply
what is the problem of macroeconomics
Yoal
Economic growth Stable prices and low unemployment
Ephraim
explain inflationcause and itis degre
Miresa Reply
what is inflation
Getu
increase in general price levels
WEETO
Good day How do I calculate this question: C= 100+5yd G= 2000 T= 2000 I(planned)=200. Suppose the actual output is 3000. What is the level of planned expenditures at this level of output?
Chisomo Reply
how to calculate actual output?
Chisomo
how to calculate the equilibrium income
Beshir
Criteria for determining money supply
Thapase Reply
who we can define macroeconomics in one line
Muhammad
Aggregate demand
Mohammed
C=k100 +9y and i=k50.calculate the equilibrium level of output
Mercy Reply
Hi
Isiaka
Hi
Geli
hy
Man
👋
Bahunda
hy how are you?
Man
ys
Amisha
how are you guys
Sekou
f9 guys
Amisha
how are you guys
Sekou
ys am also fine
Amisha
fine and you guys
Geli
from Nepal
Amisha
nawalparasi district from belatari
Amisha
nd u
Amisha
I am Camara from Guinea west Africa... happy to meet you guys here
Sekou
ma management ho
Amisha
ahile becheclor ho
Amisha
hjr ktm bta ho ani k kaam grnu hunxa tw
Amisha
belatari
Amisha
1st year ho
Amisha
nd u
Amisha
ahh
Amisha
kaha biratnagar
Amisha
ys
Amisha
kina k vo
Amisha
money as unit of account means what?
Kalombe
A unit of account is something that can be used to value goods and services and make calculations
Jim
all of you please speak in English I can't understand you're language
Muhammad
I want to know how can we define macroeconomics in one line
Muhammad
it must be .9 or 0.9 no Mpc is greater than 1 Y=100+.9Y+50 Y-.9Y=150 0.1Y/0.1=150/0.1 Y=1500
Kalombe
Mercy is it clear?😋
Kalombe
hi can someone help me on this question If a negative shocks shifts the IS curve to the left, what type of policy do you suggest so as to stabilize the level of output? discuss your answer using appropriate graph.
Galge Reply
if interest rate is increased this will will reduce the level of income shifting the curve to the left ◀️
Kalombe
Got questions? Join the online conversation and get instant answers!
Jobilize.com Reply

Get Jobilize Job Search Mobile App in your pocket Now!

Get it on Google Play Download on the App Store Now


Source:  OpenStax, Concepts of biology. OpenStax CNX. Feb 29, 2016 Download for free at http://cnx.org/content/col11487/1.9
Google Play and the Google Play logo are trademarks of Google Inc.

Notification Switch

Would you like to follow the 'Concepts of biology' conversation and receive update notifications?

Ask