<< Chapter < Page Chapter >> Page >
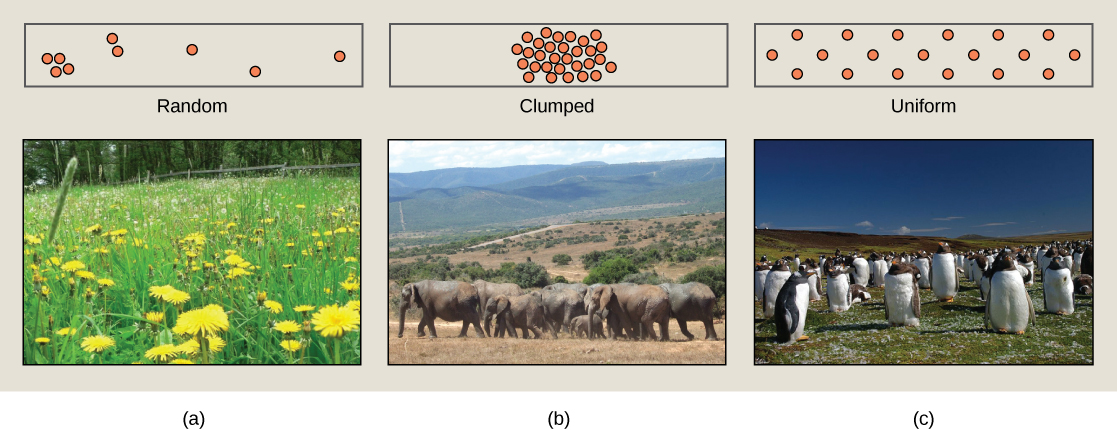
 Photo (a) shows penguins, which maintain a defined territory and, therefore, have a uniform distribution. Photo (b) shows a field of dandelions whose seeds are dispersed by wind, resulting in a random distribution patter. Photo (c) shows elephants, which travel in herds resulting in a clumped distribution pattern.
Species may have a random, clumped, or uniform distribution. Plants such as (a) dandelions with wind-dispersed seeds tend to be randomly distributed. Animals such as (b) elephants that travel in groups exhibit a clumped distribution. Territorial birds such as (c) penguins tend to have a uniform distribution. (credit a: modification of work by Rosendahl; credit b: modification of work by Rebecca Wood; credit c: modification of work by Ben Tubby)

Demography

While population size and density describe a population at one particular point in time, scientists must use demography to study the dynamics of a population. Demography is the statistical study of population changes over time: birth rates, death rates, and life expectancies. These population characteristics are often displayed in a life table.

Life tables

Life tables provide important information about the life history of an organism and the life expectancy of individuals at each age. They are modeled after actuarial tables used by the insurance industry for estimating human life expectancy. Life tables may include the probability of each age group dying before their next birthday, the percentage of surviving individuals dying at a particular age interval (their mortality rate    , and their life expectancy at each interval. An example of a life table is shown in [link] from a study of Dall mountain sheep, a species native to northwestern North America. Notice that the population is divided into age intervals (column A). The mortality rate (per 1000) shown in column D is based on the number of individuals dying during the age interval (column B), divided by the number of individuals surviving at the beginning of the interval (Column C) multiplied by 1000.

mortality rate  =   number of individuals dying number of individuals surviving   ×   1000

For example, between ages three and four, 12 individuals die out of the 776 that were remaining from the original 1000 sheep. This number is then multiplied by 1000 to give the mortality rate per thousand.

mortality rate  =   12 776   ×   1000     15.5

As can be seen from the mortality rate data (column D), a high death rate occurred when the sheep were between six months and a year old, and then increased even more from 8 to 12 years old, after which there were few survivors. The data indicate that if a sheep in this population were to survive to age one, it could be expected to live another 7.7 years on average, as shown by the life-expectancy numbers in column E.

This life table of Ovis dalli shows the number of deaths, number of survivors, mortality rate, and life expectancy at each age interval for Dall mountain sheep.
Life Table of Dall Mountain Sheep Data Adapted from Edward S. Deevey, Jr., “Life Tables for Natural Populations of Animals,” The Quarterly Review of Biology 22, no. 4 (December 1947): 283-314.
A B C D E
Age interval (years) Number dying in age interval out of 1000 born Number surviving at beginning of age interval out of 1000 born Mortality rate per 1000 alive at beginning of age interval Life expectancy or mean lifetime remaining to those attaining age interval
0–0.5 54 1000 54.0 7.06
0.5–1 145 946 153.3
1–2 12 801 15.0 7.7
2–3 13 789 16.5 6.8
3–4 12 776 15.5 5.9
4–5 30 764 39.3 5.0
5–6 46 734 62.7 4.2
6–7 48 688 69.8 3.4
7–8 69 640 107.8 2.6
8–9 132 571 231.2 1.9
9–10 187 439 426.0 1.3
10–11 156 252 619.0 0.9
11–12 90 96 937.5 0.6
12–13 3 6 500.0 1.2
13–14 3 3 1000 0.7

Survivorship curves

Another tool used by population ecologists is a survivorship curve    , which is a graph of the number of individuals surviving at each age interval versus time. These curves allow us to compare the life histories of different populations ( [link] ). There are three types of survivorship curves. In a type I curve, mortality is low in the early and middle years and occurs mostly in older individuals. Organisms exhibiting a type I survivorship typically produce few offspring and provide good care to the offspring increasing the likelihood of their survival. Humans and most mammals exhibit a type I survivorship curve. In type II curves, mortality is relatively constant throughout the entire life span, and mortality is equally likely to occur at any point in the life span. Many bird populations provide examples of an intermediate or type II survivorship curve. In type III survivorship curves, early ages experience the highest mortality with much lower mortality rates for organisms that make it to advanced years. Type III organisms typically produce large numbers of offspring, but provide very little or no care for them. Trees and marine invertebrates exhibit a type III survivorship curve because very few of these organisms survive their younger years, but those that do make it to an old age are more likely to survive for a relatively long period of time.
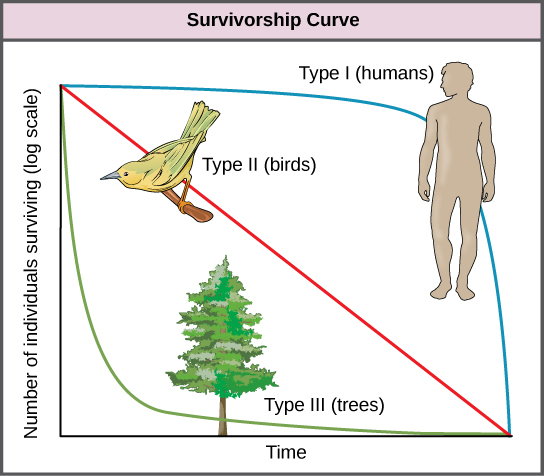
 Graph plots the log of number of individuals surviving versus time. Three curves are shown, representing type I, type II, and type III survivorship patterns. Birds exhibit a type II survivorship curve, which decreases linearly with time. Humans show a type I survivorship curve, which starts with a gentle slope that becomes increasingly steep with time. Trees show a type III survivorship pattern, which starts with a steep slope that becomes less steep with time.
Survivorship curves show the distribution of individuals in a population according to age. Humans and most mammals have a Type I survivorship curve, because death primarily occurs in the older years. Birds have a Type II survivorship curve, as death at any age is equally probable. Trees have a Type III survivorship curve because very few survive the younger years, but after a certain age, individuals are much more likely to survive.

Section summary

Populations are individuals of a species that live in a particular habitat. Ecologists measure characteristics of populations: size, density, and distribution pattern. Life tables are useful to calculate life expectancies of individual population members. Survivorship curves show the number of individuals surviving at each age interval plotted versus time.

[link] As this graph shows, population density typically decreases with increasing body size. Why do you think this is the case?

[link] Smaller animals require less food and others resources, so the environment can support more of them per unit area.

Got questions? Get instant answers now!

Questions & Answers

how does Neisseria cause meningitis
Nyibol Reply
what is microbiologist
Muhammad Reply
what is errata
Muhammad
is the branch of biology that deals with the study of microorganisms.
Ntefuni Reply
What is microbiology
Mercy Reply
studies of microbes
Louisiaste
when we takee the specimen which lumbar,spin,
Ziyad Reply
How bacteria create energy to survive?
Muhamad Reply
Bacteria doesn't produce energy they are dependent upon their substrate in case of lack of nutrients they are able to make spores which helps them to sustain in harsh environments
_Adnan
But not all bacteria make spores, l mean Eukaryotic cells have Mitochondria which acts as powerhouse for them, since bacteria don't have it, what is the substitution for it?
Muhamad
they make spores
Louisiaste
what is sporadic nd endemic, epidemic
Aminu Reply
the significance of food webs for disease transmission
Abreham
food webs brings about an infection as an individual depends on number of diseased foods or carriers dully.
Mark
explain assimilatory nitrate reduction
Esinniobiwa Reply
Assimilatory nitrate reduction is a process that occurs in some microorganisms, such as bacteria and archaea, in which nitrate (NO3-) is reduced to nitrite (NO2-), and then further reduced to ammonia (NH3).
Elkana
This process is called assimilatory nitrate reduction because the nitrogen that is produced is incorporated in the cells of microorganisms where it can be used in the synthesis of amino acids and other nitrogen products
Elkana
Examples of thermophilic organisms
Shu Reply
Give Examples of thermophilic organisms
Shu
advantages of normal Flora to the host
Micheal Reply
Prevent foreign microbes to the host
Abubakar
they provide healthier benefits to their hosts
ayesha
They are friends to host only when Host immune system is strong and become enemies when the host immune system is weakened . very bad relationship!
Mark
what is cell
faisal Reply
cell is the smallest unit of life
Fauziya
cell is the smallest unit of life
Akanni
ok
Innocent
cell is the structural and functional unit of life
Hasan
is the fundamental units of Life
Musa
what are emergency diseases
Micheal Reply
There are nothing like emergency disease but there are some common medical emergency which can occur simultaneously like Bleeding,heart attack,Breathing difficulties,severe pain heart stock.Hope you will get my point .Have a nice day ❣️
_Adnan
define infection ,prevention and control
Innocent
I think infection prevention and control is the avoidance of all things we do that gives out break of infections and promotion of health practices that promote life
Lubega
Heyy Lubega hussein where are u from?
_Adnan
en français
Adama
which site have a normal flora
ESTHER Reply
Many sites of the body have it Skin Nasal cavity Oral cavity Gastro intestinal tract
Safaa
skin
Asiina
skin,Oral,Nasal,GIt
Sadik
How can Commensal can Bacteria change into pathogen?
Sadik
How can Commensal Bacteria change into pathogen?
Sadik
all
Tesfaye
by fussion
Asiina
what are the advantages of normal Flora to the host
Micheal
what are the ways of control and prevention of nosocomial infection in the hospital
Micheal
what is inflammation
Shelly Reply
part of a tissue or an organ being wounded or bruised.
Wilfred
what term is used to name and classify microorganisms?
Micheal Reply
Binomial nomenclature
adeolu
Got questions? Join the online conversation and get instant answers!
Jobilize.com Reply

Get Jobilize Job Search Mobile App in your pocket Now!

Get it on Google Play Download on the App Store Now


Source:  OpenStax, Concepts of biology. OpenStax CNX. Feb 29, 2016 Download for free at http://cnx.org/content/col11487/1.9
Google Play and the Google Play logo are trademarks of Google Inc.

Notification Switch

Would you like to follow the 'Concepts of biology' conversation and receive update notifications?

Ask