

| << Chapter < Page | Chapter >> Page > |
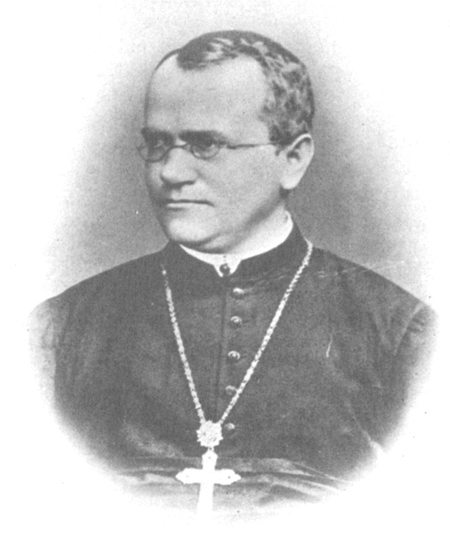
Johann Gregor Mendel (1822–1884) ( [link] ) was a lifelong learner, teacher, scientist, and man of faith. As a young adult, he joined the Augustinian Abbey of St. Thomas in Brno in what is now the Czech Republic. Supported by the monastery, he taught physics, botany, and natural science courses at the secondary and university levels. In 1856, he began a decade-long research pursuit involving inheritance patterns in honeybees and plants, ultimately settling on pea plants as his primary model system (a system with convenient characteristics that is used to study a specific biological phenomenon to gain understanding to be applied to other systems). In 1865, Mendel presented the results of his experiments with nearly 30,000 pea plants to the local natural history society. He demonstrated that traits are transmitted faithfully from parents to offspring in specific patterns. In 1866, he published his work, Experiments in Plant Hybridization, Johann Gregor Mendel, “Versuche über Pflanzenhybriden.” Verhandlungen des naturforschenden Vereines in Brünn , Bd. IV für das Jahr, 1865 Abhandlungen (1866):3–47. [for English translation, see http://www.mendelweb.org/Mendel.plain.html] in the proceedings of the Natural History Society of Brünn.
Mendel’s work went virtually unnoticed by the scientific community, which incorrectly believed that the process of inheritance involved a blending of parental traits that produced an intermediate physical appearance in offspring. This hypothetical process appeared to be correct because of what we know now as continuous variation. Continuous variation is the range of small differences we see among individuals in a characteristic like human height. It does appear that offspring are a “blend” of their parents’ traits when we look at characteristics that exhibit continuous variation. Mendel worked instead with traits that show discontinuous variation . Discontinuous variation is the variation seen among individuals when each individual shows one of two—or a very few—easily distinguishable traits, such as violet or white flowers. Mendel’s choice of these kinds of traits allowed him to see experimentally that the traits were not blended in the offspring as would have been expected at the time, but that they were inherited as distinct traits. In 1868, Mendel became abbot of the monastery and exchanged his scientific pursuits for his pastoral duties. He was not recognized for his extraordinary scientific contributions during his lifetime; in fact, it was not until 1900 that his work was rediscovered, reproduced, and revitalized by scientists on the brink of discovering the chromosomal basis of heredity.
Mendel’s seminal work was accomplished using the garden pea, Pisum sativum , to study inheritance. This species naturally self-fertilizes, meaning that pollen encounters ova within the same flower. The flower petals remain sealed tightly until pollination is completed to prevent the pollination of other plants. The result is highly inbred, or “true-breeding,” pea plants. These are plants that always produce offspring that look like the parent. By experimenting with true-breeding pea plants, Mendel avoided the appearance of unexpected traits in offspring that might occur if the plants were not true breeding. The garden pea also grows to maturity within one season, meaning that several generations could be evaluated over a relatively short time. Finally, large quantities of garden peas could be cultivated simultaneously, allowing Mendel to conclude that his results did not come about simply by chance.
Notification Switch
Would you like to follow the 'Concepts of biology' conversation and receive update notifications?

|
|

|
|

|
|

|
|

|
|

|
|

|
|

|
|
|
|
|

|
|
|
|