<< Chapter < Page Chapter >> Page >
By the end of this section, you will be able to:
  • Discuss how human population growth can be exponential
  • Explain how humans have expanded the carrying capacity of their habitat
  • Relate population growth and age structure to the level of economic development in different countries
  • Discuss the long-term implications of unchecked human population growth

Concepts of animal population dynamics can be applied to human population growth. Humans are not unique in their ability to alter their environment. For example, beaver dams alter the stream environment where they are built. Humans, however, have the ability to alter their environment to increase its carrying capacity, sometimes to the detriment of other species. Earth’s human population and their use of resources are growing rapidly, to the extent that some worry about the ability of Earth’s environment to sustain its human population. Long-term exponential growth carries with it the potential risks of famine, disease, and large-scale death, as well as social consequences of crowding such as increased crime.

Human technology and particularly our harnessing of the energy contained in fossil fuels have caused unprecedented changes to Earth’s environment, altering ecosystems to the point where some may be in danger of collapse. Changes on a global scale including depletion of the ozone layer, desertification and topsoil loss, and global climate change are caused by human activities.

The world’s human population is presently growing exponentially ( [link] ).

 Graph plots the world population growth from 1000 AD to the present. The curve starts out flat and then becomes increasingly steep. A sharp increase in population occurs around 1900 AD. In 1000 AD the population was around 265 million. In 2000 AD it was around 6 billion.
Human population growth since 1000 AD is exponential.

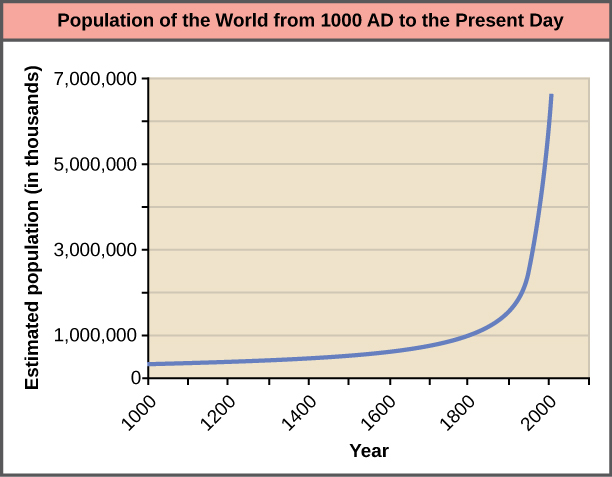
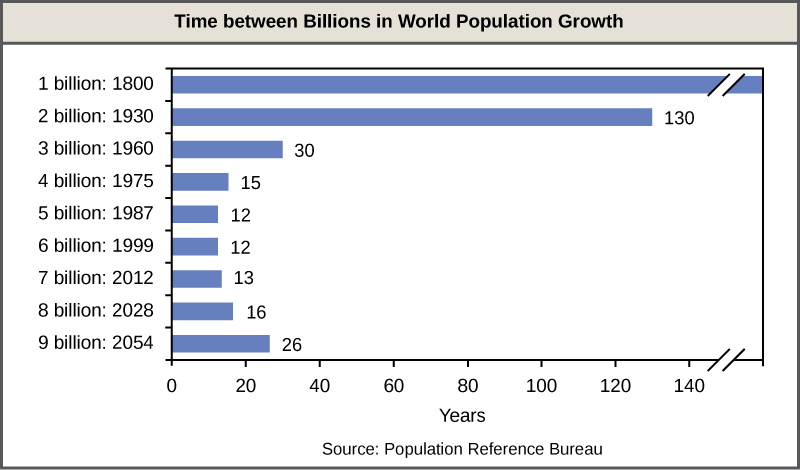
A consequence of exponential growth rate is that the time that it takes to add a particular number of humans to the population is becoming shorter. [link] shows that 123 years were necessary to add 1 billion humans between 1804 and 1930, but it only took 24 years to add the two billion people between 1975 and 1999. This acceleration in growth rate will likely begin to decrease in the coming decades. Despite this, the population will continue to increase and the threat of overpopulation remains, particularly because the damage caused to ecosystems and biodiversity is lowering the human carrying capacity of the planet.

 Bar graph shows the number of years it has taken to add each billion people to the world population. By 1800, there were about one billion people on Earth. It took 130 years, until 1930, for the population to reach two million. Thirty years later, in 1960, the population reached three billion, and 15 years after that, in 1975, the population reached four billion. The population reached five billion in 1987, and six billion in 1999, each twelve years apart. Currently, the world population is nearly seven billion. The population is projected to reach eight billion in 2028, and nine billion in 2054.
The time between the addition of each billion human beings to Earth decreases over time. (credit: modification of work by Ryan T. Cragun)

Concept in action

Click through this interactive view of how human populations have changed over time.

Overcoming density-dependent regulation

Humans are unique in their ability to alter their environment in myriad ways. This ability is responsible for human population growth because it resets the carrying capacity and overcomes density-dependent growth regulation. Much of this ability is related to human intelligence, society, and communication. Humans construct shelters to protect themselves from the elements and have developed agriculture and domesticated animals to increase their food supplies. In addition, humans use language to communicate this technology to new generations, allowing them to improve upon previous accomplishments.

Questions & Answers

how do you get the 2/50
Abba Reply
number of sport play by 50 student construct discrete data
Aminu Reply
width of the frangebany leaves on how to write a introduction
Theresa Reply
Solve the mean of variance
Veronica Reply
Step 1: Find the mean. To find the mean, add up all the scores, then divide them by the number of scores. ... Step 2: Find each score's deviation from the mean. ... Step 3: Square each deviation from the mean. ... Step 4: Find the sum of squares. ... Step 5: Divide the sum of squares by n – 1 or N.
kenneth
what is error
Yakuba Reply
Is mistake done to something
Vutshila
Hy
anas
hy
What is the life teble
anas
hy
Jibrin
statistics is the analyzing of data
Tajudeen Reply
what is statics?
Zelalem Reply
how do you calculate mean
Gloria Reply
diveving the sum if all values
Shaynaynay
let A1,A2 and A3 events be independent,show that (A1)^c, (A2)^c and (A3)^c are independent?
Fisaye Reply
what is statistics
Akhisani Reply
data collected all over the world
Shaynaynay
construct a less than and more than table
Imad Reply
The sample of 16 students is taken. The average age in the sample was 22 years with astandard deviation of 6 years. Construct a 95% confidence interval for the age of the population.
Aschalew Reply
Bhartdarshan' is an internet-based travel agency wherein customer can see videos of the cities they plant to visit. The number of hits daily is a normally distributed random variable with a mean of 10,000 and a standard deviation of 2,400 a. what is the probability of getting more than 12,000 hits? b. what is the probability of getting fewer than 9,000 hits?
Akshay Reply
Bhartdarshan'is an internet-based travel agency wherein customer can see videos of the cities they plan to visit. The number of hits daily is a normally distributed random variable with a mean of 10,000 and a standard deviation of 2,400. a. What is the probability of getting more than 12,000 hits
Akshay
1
Bright
Sorry i want to learn more about this question
Bright
Someone help
Bright
a= 0.20233 b=0.3384
Sufiyan
a
Shaynaynay
How do I interpret level of significance?
Mohd Reply
It depends on your business problem or in Machine Learning you could use ROC- AUC cruve to decide the threshold value
Shivam
how skewness and kurtosis are used in statistics
Owen Reply
yes what is it
Taneeya
Got questions? Join the online conversation and get instant answers!
Jobilize.com Reply

Get Jobilize Job Search Mobile App in your pocket Now!

Get it on Google Play Download on the App Store Now


Source:  OpenStax, Concepts of biology. OpenStax CNX. Feb 29, 2016 Download for free at http://cnx.org/content/col11487/1.9
Google Play and the Google Play logo are trademarks of Google Inc.

Notification Switch

Would you like to follow the 'Concepts of biology' conversation and receive update notifications?

Ask