<< Chapter < Page Chapter >> Page >
By the end of this section, you will be able to:
  • Discuss the need for a comprehensive classification system
  • List the different levels of the taxonomic classification system
  • Describe how systematics and taxonomy relate to phylogeny

All life on Earth evolved from a common ancestor. Biologists map how organisms are related by constructing phylogenetic trees. In other words, a “tree of life” can be constructed to illustrate when different organisms evolved and to show the relationships among different organisms, as shown in [link] . Notice that from a single point, the three domains of Archaea, Bacteria, and Eukarya diverge and then branch repeatedly. The small branch that plants and animals (including humans) occupy in this diagram shows how recently these groups had their origin compared with other groups.

This phylogenetic tree shows that the three domains of life, Bacteria, Archaea and Eukarya, all arose from a common ancestor.
In the evolution of life on Earth, the three domains of life—Archaea, Bacteria, and Eukarya—branch from a single point. (credit: modification of work by Eric Gaba)

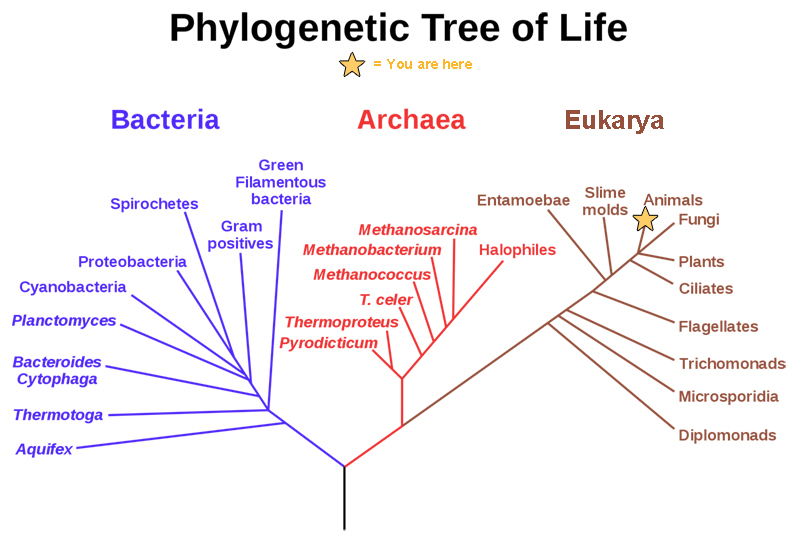
The phylogenetic tree in [link] illustrates the pathway of evolutionary history. The pathway can be traced from the origin of life to any individual species by navigating through the evolutionary branches between the two points. Also, by starting with a single species and tracing backward to any branch point, the organisms related to it by various degrees of closeness can be identified.

A phylogeny    is the evolutionary history and the relationships among a species or group of species. The study of organisms with the purpose of deriving their relationships is called systematics    .

Many disciplines within the study of biology contribute to understanding how past and present life evolved over time, and together they contribute to building, updating, and maintaining the “tree of life.” Information gathered may include data collected from fossils, from studying morphology, from the structure of body parts, or from molecular structure, such as the sequence of amino acids in proteins or DNA nucleotides. By considering the trees generated by different sets of data scientists can put together the phylogeny of a species.

Scientists continue to discover new species of life on Earth as well as new character information, thus trees change as new data arrive.

The levels of classification

Taxonomy (which literally means “arrangement law”) is the science of naming and grouping species to construct an internationally shared classification system. The taxonomic classification system (also called the Linnaean system after its inventor, Carl Linnaeus, a Swedish naturalist) uses a hierarchical model. A hierarchical system has levels and each group at one of the levels includes groups at the next lowest level, so that at the lowest level each member belongs to a series of nested groups. An analogy is the nested series of directories on the main disk drive of a computer. For example, in the most inclusive grouping, scientists divide organisms into three domains : Bacteria, Archaea, and Eukarya. Within each domain is a second level called a kingdom    . Each domain contains several kingdoms. Within kingdoms, the subsequent categories of increasing specificity are: phylum    , class    , order    , family    , genus    , and species    .

Questions & Answers

differentiate between demand and supply giving examples
Lambiv Reply
differentiated between demand and supply using examples
Lambiv
what is labour ?
Lambiv
how will I do?
Venny Reply
how is the graph works?I don't fully understand
Rezat Reply
information
Eliyee
devaluation
Eliyee
t
WARKISA
hi guys good evening to all
Lambiv
multiple choice question
Aster Reply
appreciation
Eliyee
explain perfect market
Lindiwe Reply
In economics, a perfect market refers to a theoretical construct where all participants have perfect information, goods are homogenous, there are no barriers to entry or exit, and prices are determined solely by supply and demand. It's an idealized model used for analysis,
Ezea
What is ceteris paribus?
Shukri Reply
other things being equal
AI-Robot
When MP₁ becomes negative, TP start to decline. Extuples Suppose that the short-run production function of certain cut-flower firm is given by: Q=4KL-0.6K2 - 0.112 • Where is quantity of cut flower produced, I is labour input and K is fixed capital input (K-5). Determine the average product of lab
Kelo
Extuples Suppose that the short-run production function of certain cut-flower firm is given by: Q=4KL-0.6K2 - 0.112 • Where is quantity of cut flower produced, I is labour input and K is fixed capital input (K-5). Determine the average product of labour (APL) and marginal product of labour (MPL)
Kelo
yes,thank you
Shukri
Can I ask you other question?
Shukri
what is monopoly mean?
Habtamu Reply
What is different between quantity demand and demand?
Shukri Reply
Quantity demanded refers to the specific amount of a good or service that consumers are willing and able to purchase at a give price and within a specific time period. Demand, on the other hand, is a broader concept that encompasses the entire relationship between price and quantity demanded
Ezea
ok
Shukri
how do you save a country economic situation when it's falling apart
Lilia Reply
what is the difference between economic growth and development
Fiker Reply
Economic growth as an increase in the production and consumption of goods and services within an economy.but Economic development as a broader concept that encompasses not only economic growth but also social & human well being.
Shukri
production function means
Jabir
What do you think is more important to focus on when considering inequality ?
Abdisa Reply
any question about economics?
Awais Reply
sir...I just want to ask one question... Define the term contract curve? if you are free please help me to find this answer 🙏
Asui
it is a curve that we get after connecting the pareto optimal combinations of two consumers after their mutually beneficial trade offs
Awais
thank you so much 👍 sir
Asui
In economics, the contract curve refers to the set of points in an Edgeworth box diagram where both parties involved in a trade cannot be made better off without making one of them worse off. It represents the Pareto efficient allocations of goods between two individuals or entities, where neither p
Cornelius
In economics, the contract curve refers to the set of points in an Edgeworth box diagram where both parties involved in a trade cannot be made better off without making one of them worse off. It represents the Pareto efficient allocations of goods between two individuals or entities,
Cornelius
Suppose a consumer consuming two commodities X and Y has The following utility function u=X0.4 Y0.6. If the price of the X and Y are 2 and 3 respectively and income Constraint is birr 50. A,Calculate quantities of x and y which maximize utility. B,Calculate value of Lagrange multiplier. C,Calculate quantities of X and Y consumed with a given price. D,alculate optimum level of output .
Feyisa Reply
Answer
Feyisa
c
Jabir
the market for lemon has 10 potential consumers, each having an individual demand curve p=101-10Qi, where p is price in dollar's per cup and Qi is the number of cups demanded per week by the i th consumer.Find the market demand curve using algebra. Draw an individual demand curve and the market dema
Gsbwnw Reply
suppose the production function is given by ( L, K)=L¼K¾.assuming capital is fixed find APL and MPL. consider the following short run production function:Q=6L²-0.4L³ a) find the value of L that maximizes output b)find the value of L that maximizes marginal product
Abdureman
types of unemployment
Yomi Reply
What is the difference between perfect competition and monopolistic competition?
Mohammed
Got questions? Join the online conversation and get instant answers!
Jobilize.com Reply

Get Jobilize Job Search Mobile App in your pocket Now!

Get it on Google Play Download on the App Store Now


Source:  OpenStax, Concepts of biology. OpenStax CNX. Feb 29, 2016 Download for free at http://cnx.org/content/col11487/1.9
Google Play and the Google Play logo are trademarks of Google Inc.

Notification Switch

Would you like to follow the 'Concepts of biology' conversation and receive update notifications?

Ask