

| << Chapter < Page | Chapter >> Page > |
Conceptual models are useful for describing ecosystem structure and dynamics and for demonstrating the relationships between different organisms in a community and their environment. Conceptual models are usually depicted graphically as flow charts. The organisms and their resources are grouped into specific compartments with arrows showing the relationship and transfer of energy or nutrients between them. Thus, these diagrams are sometimes called compartment models.
To model the cycling of mineral nutrients, organic and inorganic nutrients are subdivided into those that are bioavailable (ready to be incorporated into biological macromolecules) and those that are not. For example, in a terrestrial ecosystem near a deposit of coal, carbon will be available to the plants of this ecosystem as carbon dioxide gas in a short-term period, not from the carbon-rich coal itself. However, over a longer period, microorganisms capable of digesting coal will incorporate its carbon or release it as natural gas (methane, CH 4 ), changing this unavailable organic source into an available one. This conversion is greatly accelerated by the combustion of fossil fuels by humans, which releases large amounts of carbon dioxide into the atmosphere. This is thought to be a major factor in the rise of the atmospheric carbon dioxide levels in the industrial age. The carbon dioxide released from burning fossil fuels is produced faster than photosynthetic organisms can use it. This process is intensified by the reduction of photosynthetic trees because of worldwide deforestation. Most scientists agree that high atmospheric carbon dioxide is a major cause of global climate change.
Conceptual models are also used to show the flow of energy through particular ecosystems. [link] is based on Howard T. Odum’s classical study of the Silver Springs, Florida, holistic ecosystem in the mid-twentieth century. Howard T. Odum, “Trophic Structure and Productivity of Silver Springs, Florida,” Ecological Monographs 27, no. 1 (1957): 47–112. This study shows the energy content and transfer between various ecosystem compartments.
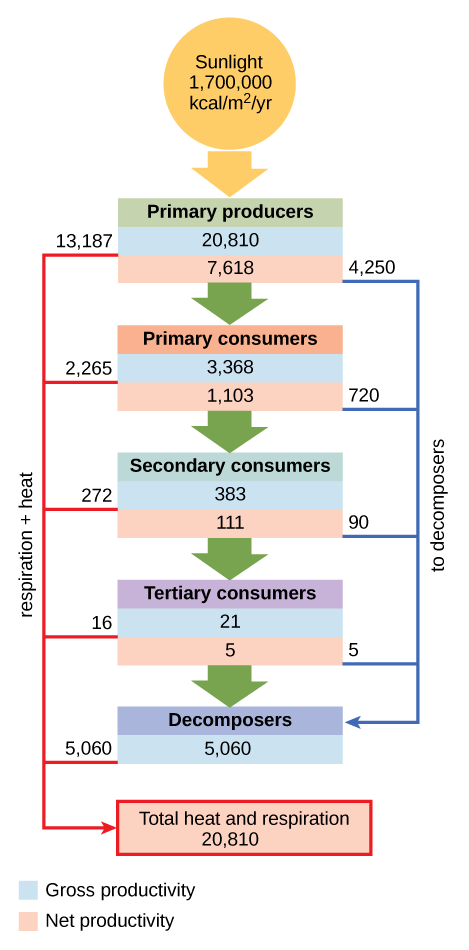
Why do you think the value for gross productivity of the primary producers is the same as the value for total heat and respiration (20,810 kcal/m 2 /yr)?
The major limitation of conceptual models is their inability to predict the consequences of changes in ecosystem species and/or environment. Ecosystems are dynamic entities and subject to a variety of abiotic and biotic disturbances caused by natural forces and/or human activity. Ecosystems altered from their initial equilibrium state can often recover from such disturbances and return to a state of equilibrium. As most ecosystems are subject to periodic disturbances and are often in a state of change, they are usually either moving toward or away from their equilibrium state. There are many of these equilibrium states among the various components of an ecosystem, which affects the ecosystem overall. Furthermore, as humans have the ability to greatly and rapidly alter the species content and habitat of an ecosystem, the need for predictive models that enable understanding of how ecosystems respond to these changes becomes more crucial.
Analytical models often use simple, linear components of ecosystems, such as food chains, and are known to be complex mathematically; therefore, they require a significant amount of mathematical knowledge and expertise. Although analytical models have great potential, their simplification of complex ecosystems is thought to limit their accuracy. Simulation models that use computer programs are better able to deal with the complexities of ecosystem structure.
A recent development in simulation modeling uses supercomputers to create and run individual-based simulations, which accounts for the behavior of individual organisms and their effects on the ecosystem as a whole. These simulations are considered to be the most accurate and predictive of the complex responses of ecosystems to disturbances.
Visit The Darwin Project to view a variety of ecosystem models.
Ecosystems exist on land, at sea, in the air, and underground. Different ways of modeling ecosystems are necessary to understand how environmental disturbances will affect ecosystem structure and dynamics. Conceptual models are useful to show the general relationships between organisms and the flow of materials or energy between them. Analytical models are used to describe linear food chains, and simulation models work best with holistic food webs.
[link] Why do you think the value for gross productivity of the primary producers is the same as the value for total heat and respiration (20,810 kcal/m 2 /yr)?
[link] According to the first law of thermodynamics, energy can neither be created nor destroyed. Eventually, all energy consumed by living systems is lost as heat or used for respiration, and the total energy output of the system must equal the energy that went into it.
Notification Switch
Would you like to follow the 'Biology' conversation and receive update notifications?

|
|
|
|
|

|
|

|
|

|
|

|
|

|
|

|
|

|
|
|
|
|
|
|
|

|