<< Chapter < Page Chapter >> Page >

The law of independent assortment also indicates that a cross between yellow, wrinkled ( YYrr ) and green, round ( yyRR ) parents would yield the same F 1 and F 2 offspring as in the YYRR x yyrr cross.

The physical basis for the law of independent assortment also lies in meiosis I, in which the different homologous pairs line up in random orientations. Each gamete can contain any combination of paternal and maternal chromosomes (and therefore the genes on them) because the orientation of tetrads on the metaphase plane is random.

Forked-line method

When more than two genes are being considered, the Punnett-square method becomes unwieldy. For instance, examining a cross involving four genes would require a 16 × 16 grid containing 256 boxes. It would be extremely cumbersome to manually enter each genotype. For more complex crosses, the forked-line and probability methods are preferred.

To prepare a forked-line diagram for a cross between F 1 heterozygotes resulting from a cross between AABBCC and aabbcc parents, we first create rows equal to the number of genes being considered, and then segregate the alleles in each row on forked lines according to the probabilities for individual monohybrid crosses ( [link] ). We then multiply the values along each forked path to obtain the F 2 offspring probabilities. Note that this process is a diagrammatic version of the product rule. The values along each forked pathway can be multiplied because each gene assorts independently. For a trihybrid cross, the F 2 phenotypic ratio is 27:9:9:9:3:3:3:1.
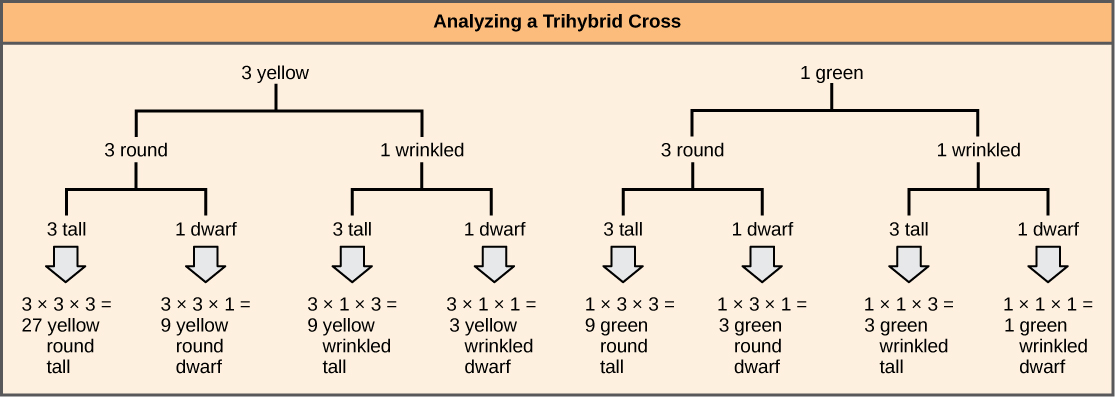
 A forked-line diagram is shown for the F_{2} generation of a trihybrid cross of pea plants with the dominant yellow, round, and tall phenotype with pea plants of the recessive green, wrinkled, dwarf phenotype. The top row shows that the color ratio is 3 yellow to 1 green in the F_{2} generation. The second row shows that the probability that plants of either pea color having the round or wrinkled texture is 3 to 1. The third row shows that the probability of plants with either of the above textures having a round or wrinkled phenotype is 3 to 1. The probability of all three phenotypes occurring together is determined by multiplying each individual probability together. The probability ratio is 27 yellow/round/tall: 9 yellow/round/dwarf: 9 yellow/wrinked/tall: 3 yellow/wrinkled/dwarf: 9 green/round/tall: 3 green/round/dwarf: 3 green/wrinkled/tall: 1 green/wrinkled/dwarf.
The forked-line method can be used to analyze a trihybrid cross. Here, the probability for color in the F 2 generation occupies the top row (3 yellow:1 green). The probability for shape occupies the second row (3 round:1 wrinked), and the probability for height occupies the third row (3 tall:1 dwarf). The probability for each possible combination of traits is calculated by multiplying the probability for each individual trait. Thus, the probability of F 2 offspring having yellow, round, and tall traits is 3 × 3 × 3, or 27.

Probability method

While the forked-line method is a diagrammatic approach to keeping track of probabilities in a cross, the probability method gives the proportions of offspring expected to exhibit each phenotype (or genotype) without the added visual assistance. Both methods make use of the product rule and consider the alleles for each gene separately. Earlier, we examined the phenotypic proportions for a trihybrid cross using the forked-line method; now we will use the probability method to examine the genotypic proportions for a cross with even more genes.

For a trihybrid cross, writing out the forked-line method is tedious, albeit not as tedious as using the Punnett-square method. To fully demonstrate the power of the probability method, however, we can consider specific genetic calculations. For instance, for a tetrahybrid cross between individuals that are heterozygotes for all four genes, and in which all four genes are sorting independently and in a dominant and recessive pattern, what proportion of the offspring will be expected to be homozygous recessive for all four alleles? Rather than writing out every possible genotype, we can use the probability method. We know that for each gene, the fraction of homozygous recessive offspring will be 1/4. Therefore, multiplying this fraction for each of the four genes, (1/4) × (1/4) × (1/4) × (1/4), we determine that 1/256 of the offspring will be quadruply homozygous recessive.

Questions & Answers

how do you get the 2/50
Abba Reply
number of sport play by 50 student construct discrete data
Aminu Reply
width of the frangebany leaves on how to write a introduction
Theresa Reply
Solve the mean of variance
Veronica Reply
Step 1: Find the mean. To find the mean, add up all the scores, then divide them by the number of scores. ... Step 2: Find each score's deviation from the mean. ... Step 3: Square each deviation from the mean. ... Step 4: Find the sum of squares. ... Step 5: Divide the sum of squares by n – 1 or N.
kenneth
what is error
Yakuba Reply
Is mistake done to something
Vutshila
Hy
anas
hy
What is the life teble
anas
hy
Jibrin
statistics is the analyzing of data
Tajudeen Reply
what is statics?
Zelalem Reply
how do you calculate mean
Gloria Reply
diveving the sum if all values
Shaynaynay
let A1,A2 and A3 events be independent,show that (A1)^c, (A2)^c and (A3)^c are independent?
Fisaye Reply
what is statistics
Akhisani Reply
data collected all over the world
Shaynaynay
construct a less than and more than table
Imad Reply
The sample of 16 students is taken. The average age in the sample was 22 years with astandard deviation of 6 years. Construct a 95% confidence interval for the age of the population.
Aschalew Reply
Bhartdarshan' is an internet-based travel agency wherein customer can see videos of the cities they plant to visit. The number of hits daily is a normally distributed random variable with a mean of 10,000 and a standard deviation of 2,400 a. what is the probability of getting more than 12,000 hits? b. what is the probability of getting fewer than 9,000 hits?
Akshay Reply
Bhartdarshan'is an internet-based travel agency wherein customer can see videos of the cities they plan to visit. The number of hits daily is a normally distributed random variable with a mean of 10,000 and a standard deviation of 2,400. a. What is the probability of getting more than 12,000 hits
Akshay
1
Bright
Sorry i want to learn more about this question
Bright
Someone help
Bright
a= 0.20233 b=0.3384
Sufiyan
a
Shaynaynay
How do I interpret level of significance?
Mohd Reply
It depends on your business problem or in Machine Learning you could use ROC- AUC cruve to decide the threshold value
Shivam
how skewness and kurtosis are used in statistics
Owen Reply
yes what is it
Taneeya
Got questions? Join the online conversation and get instant answers!
Jobilize.com Reply

Get Jobilize Job Search Mobile App in your pocket Now!

Get it on Google Play Download on the App Store Now


Source:  OpenStax, Biology. OpenStax CNX. Feb 29, 2016 Download for free at http://cnx.org/content/col11448/1.10
Google Play and the Google Play logo are trademarks of Google Inc.

Notification Switch

Would you like to follow the 'Biology' conversation and receive update notifications?

Ask