<< Chapter < Page Chapter >> Page >

Patterns of biodiversity

Biodiversity is not evenly distributed on Earth. Lake Victoria contained almost 500 species of cichlids alone, ignoring the other fish families present in the lake. All of these species were found only in Lake Victoria; therefore, the 500 species of cichlids were endemic. Endemic species are found in only one location. Endemics with highly restricted distributions are particularly vulnerable to extinction. Higher taxonomic levels, such as genera and families, can also be endemic. Lake Huron contains about 79 species of fish, all of which are found in many other lakes in North America. What accounts for the difference in fish diversity in these two lakes? Lake Victoria is a tropical lake, while Lake Huron is a temperate lake. Lake Huron in its present form is only about 7,000 years old, while Lake Victoria in its present form is about 15,000 years old. Biogeographers have suggested these two factors, latitude and age, are two of several hypotheses to explain biodiversity patterns on the planet.

Career connection

Biogeographer

Biogeography is the study of the distribution of the world’s species—both in the past and in the present. The work of biogeographers is critical to understanding our physical environment, how the environment affects species, and how environmental changes impact the distribution of a species; it has also been critical to developing evolutionary theory. Biogeographers need to understand both biology and ecology. They also need to be well-versed in evolutionary studies, soil science, and climatology.

There are three main fields of study under the heading of biogeography: ecological biogeography, historical biogeography (called paleobiogeography), and conservation biogeography. Ecological biogeography studies the current factors affecting the distribution of plants and animals. Historical biogeography, as the name implies, studies the past distribution of species. Conservation biogeography, on the other hand, is focused on the protection and restoration of species based upon known historical and current ecological information. Each of these fields considers both zoogeography and phytogeography—the past and present distribution of animals and plants.

One of the oldest observed patterns in ecology is that species biodiversity in almost every taxonomic group increases as latitude declines. In other words, biodiversity increases closer to the equator ( [link] ).

The number of amphibian species in different areas is specified on a world map. The greatest number of species, 61-144, are found in the Amazon region of South America and in parts of Africa. Between 21 and 60 species are found in other parts of South America and Africa, and in the eastern United States and Southeast Asia. Other parts of the world have between 1 and 20 amphibian species, with the fewest species occurring at northern and southern latitudes. Generally, more amphibian species are found in warmer, wetter climates.
This map illustrates the number of amphibian species across the globe and shows the trend toward higher biodiversity at lower latitudes. A similar pattern is observed for most taxonomic groups.

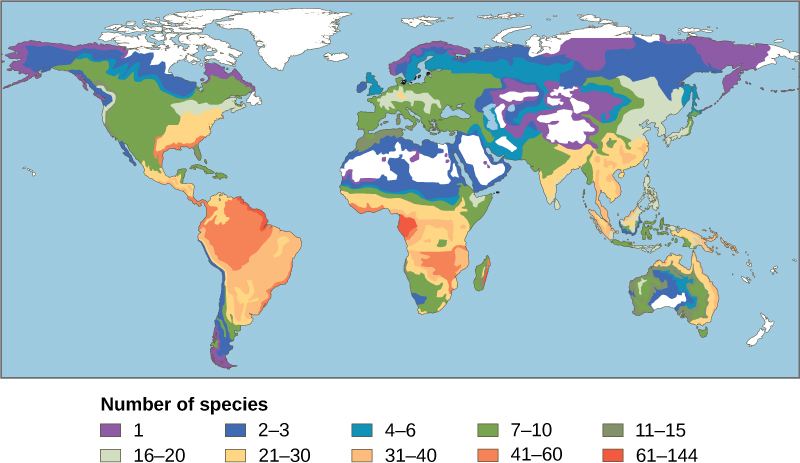
It is not yet clear why biodiversity increases closer to the equator, but hypotheses include the greater age of the ecosystems in the tropics versus temperate regions that were largely devoid of life or drastically impoverished during the last glaciation. The idea is that greater age provides more time for speciation. Another possible explanation is the increased energy the tropics receive from the sun versus the decreased energy that temperate and polar regions receive. It is not entirely clear how greater energy input could translate into more species. The complexity of tropical ecosystems may promote speciation by increasing the heterogeneity    , or number of ecological niches, in the tropics relative to higher latitudes. The greater heterogeneity provides more opportunities for coevolution, specialization, and perhaps greater selection pressures leading to population differentiation. However, this hypothesis suffers from some circularity—ecosystems with more species encourage speciation, but how did they get more species to begin with? The tropics have been perceived as being more stable than temperate regions, which have a pronounced climate and day-length seasonality. The tropics have their own forms of seasonality, such as rainfall, but they are generally assumed to be more stable environments and this stability might promote speciation.

Questions & Answers

differentiate between demand and supply giving examples
Lambiv Reply
differentiated between demand and supply using examples
Lambiv
what is labour ?
Lambiv
how will I do?
Venny Reply
how is the graph works?I don't fully understand
Rezat Reply
information
Eliyee
devaluation
Eliyee
t
WARKISA
hi guys good evening to all
Lambiv
multiple choice question
Aster Reply
appreciation
Eliyee
explain perfect market
Lindiwe Reply
In economics, a perfect market refers to a theoretical construct where all participants have perfect information, goods are homogenous, there are no barriers to entry or exit, and prices are determined solely by supply and demand. It's an idealized model used for analysis,
Ezea
What is ceteris paribus?
Shukri Reply
other things being equal
AI-Robot
When MP₁ becomes negative, TP start to decline. Extuples Suppose that the short-run production function of certain cut-flower firm is given by: Q=4KL-0.6K2 - 0.112 • Where is quantity of cut flower produced, I is labour input and K is fixed capital input (K-5). Determine the average product of lab
Kelo
Extuples Suppose that the short-run production function of certain cut-flower firm is given by: Q=4KL-0.6K2 - 0.112 • Where is quantity of cut flower produced, I is labour input and K is fixed capital input (K-5). Determine the average product of labour (APL) and marginal product of labour (MPL)
Kelo
yes,thank you
Shukri
Can I ask you other question?
Shukri
what is monopoly mean?
Habtamu Reply
What is different between quantity demand and demand?
Shukri Reply
Quantity demanded refers to the specific amount of a good or service that consumers are willing and able to purchase at a give price and within a specific time period. Demand, on the other hand, is a broader concept that encompasses the entire relationship between price and quantity demanded
Ezea
ok
Shukri
how do you save a country economic situation when it's falling apart
Lilia Reply
what is the difference between economic growth and development
Fiker Reply
Economic growth as an increase in the production and consumption of goods and services within an economy.but Economic development as a broader concept that encompasses not only economic growth but also social & human well being.
Shukri
production function means
Jabir
What do you think is more important to focus on when considering inequality ?
Abdisa Reply
any question about economics?
Awais Reply
sir...I just want to ask one question... Define the term contract curve? if you are free please help me to find this answer 🙏
Asui
it is a curve that we get after connecting the pareto optimal combinations of two consumers after their mutually beneficial trade offs
Awais
thank you so much 👍 sir
Asui
In economics, the contract curve refers to the set of points in an Edgeworth box diagram where both parties involved in a trade cannot be made better off without making one of them worse off. It represents the Pareto efficient allocations of goods between two individuals or entities, where neither p
Cornelius
In economics, the contract curve refers to the set of points in an Edgeworth box diagram where both parties involved in a trade cannot be made better off without making one of them worse off. It represents the Pareto efficient allocations of goods between two individuals or entities,
Cornelius
Suppose a consumer consuming two commodities X and Y has The following utility function u=X0.4 Y0.6. If the price of the X and Y are 2 and 3 respectively and income Constraint is birr 50. A,Calculate quantities of x and y which maximize utility. B,Calculate value of Lagrange multiplier. C,Calculate quantities of X and Y consumed with a given price. D,alculate optimum level of output .
Feyisa Reply
Answer
Feyisa
c
Jabir
the market for lemon has 10 potential consumers, each having an individual demand curve p=101-10Qi, where p is price in dollar's per cup and Qi is the number of cups demanded per week by the i th consumer.Find the market demand curve using algebra. Draw an individual demand curve and the market dema
Gsbwnw Reply
suppose the production function is given by ( L, K)=L¼K¾.assuming capital is fixed find APL and MPL. consider the following short run production function:Q=6L²-0.4L³ a) find the value of L that maximizes output b)find the value of L that maximizes marginal product
Abdureman
types of unemployment
Yomi Reply
What is the difference between perfect competition and monopolistic competition?
Mohammed
Got questions? Join the online conversation and get instant answers!
Jobilize.com Reply

Get Jobilize Job Search Mobile App in your pocket Now!

Get it on Google Play Download on the App Store Now


Source:  OpenStax, Biology. OpenStax CNX. Feb 29, 2016 Download for free at http://cnx.org/content/col11448/1.10
Google Play and the Google Play logo are trademarks of Google Inc.

Notification Switch

Would you like to follow the 'Biology' conversation and receive update notifications?

Ask