<< Chapter < Page Chapter >> Page >

The law of independent assortment also indicates that a cross between yellow, wrinkled ( YYrr ) and green, round ( yyRR ) parents would yield the same F 1 and F 2 offspring as in the YYRR x yyrr cross.

The physical basis for the law of independent assortment also lies in meiosis I, in which the different homologous pairs line up in random orientations. Each gamete can contain any combination of paternal and maternal chromosomes (and therefore the genes on them) because the orientation of tetrads on the metaphase plane is random.

Forked-line method

When more than two genes are being considered, the Punnett-square method becomes unwieldy. For instance, examining a cross involving four genes would require a 16 × 16 grid containing 256 boxes. It would be extremely cumbersome to manually enter each genotype. For more complex crosses, the forked-line and probability methods are preferred.

To prepare a forked-line diagram for a cross between F 1 heterozygotes resulting from a cross between AABBCC and aabbcc parents, we first create rows equal to the number of genes being considered, and then segregate the alleles in each row on forked lines according to the probabilities for individual monohybrid crosses ( [link] ). We then multiply the values along each forked path to obtain the F 2 offspring probabilities. Note that this process is a diagrammatic version of the product rule. The values along each forked pathway can be multiplied because each gene assorts independently. For a trihybrid cross, the F 2 phenotypic ratio is 27:9:9:9:3:3:3:1.

 A forked-line diagram is shown for the F_{2} generation of a trihybrid cross of pea plants with the dominant yellow, round, and tall phenotype with pea plants of the recessive green, wrinkled, dwarf phenotype. The top row shows that the color ratio is 3 yellow to 1 green in the F_{2} generation. The second row shows that the probability that plants of either pea color having the round or wrinkled texture is 3 to 1. The third row shows that the probability of plants with either of the above textures having a round or wrinkled phenotype is 3 to 1. The probability of all three phenotypes occurring together is determined by multiplying each individual probability together. The probability ratio is 27 yellow/round/tall: 9 yellow/round/dwarf: 9 yellow/wrinked/tall: 3 yellow/wrinkled/dwarf: 9 green/round/tall: 3 green/round/dwarf: 3 green/wrinkled/tall: 1 green/wrinkled/dwarf.
The forked-line method can be used to analyze a trihybrid cross. Here, the probability for color in the F 2 generation occupies the top row (3 yellow:1 green). The probability for shape occupies the second row (3 round:1 wrinked), and the probability for height occupies the third row (3 tall:1 dwarf). The probability for each possible combination of traits is calculated by multiplying the probability for each individual trait. Thus, the probability of F 2 offspring having yellow, round, and tall traits is 3 × 3 × 3, or 27.

Probability method

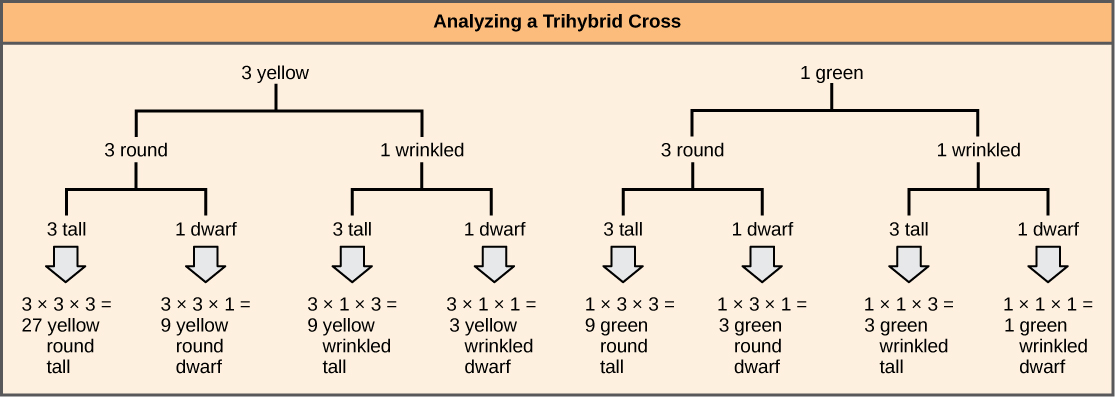
While the forked-line method is a diagrammatic approach to keeping track of probabilities in a cross, the probability method gives the proportions of offspring expected to exhibit each phenotype (or genotype) without the added visual assistance. Both methods make use of the product rule and consider the alleles for each gene separately. Earlier, we examined the phenotypic proportions for a trihybrid cross using the forked-line method; now we will use the probability method to examine the genotypic proportions for a cross with even more genes.

For a trihybrid cross, writing out the forked-line method is tedious, albeit not as tedious as using the Punnett-square method. To fully demonstrate the power of the probability method, however, we can consider specific genetic calculations. For instance, for a tetrahybrid cross between individuals that are heterozygotes for all four genes, and in which all four genes are sorting independently and in a dominant and recessive pattern, what proportion of the offspring will be expected to be homozygous recessive for all four alleles? Rather than writing out every possible genotype, we can use the probability method. We know that for each gene, the fraction of homozygous recessive offspring will be 1/4. Therefore, multiplying this fraction for each of the four genes, (1/4) × (1/4) × (1/4) × (1/4), we determine that 1/256 of the offspring will be quadruply homozygous recessive.

Questions & Answers

differentiate between demand and supply giving examples
Lambiv Reply
differentiated between demand and supply using examples
Lambiv
what is labour ?
Lambiv
how will I do?
Venny Reply
how is the graph works?I don't fully understand
Rezat Reply
information
Eliyee
devaluation
Eliyee
t
WARKISA
hi guys good evening to all
Lambiv
multiple choice question
Aster Reply
appreciation
Eliyee
explain perfect market
Lindiwe Reply
In economics, a perfect market refers to a theoretical construct where all participants have perfect information, goods are homogenous, there are no barriers to entry or exit, and prices are determined solely by supply and demand. It's an idealized model used for analysis,
Ezea
What is ceteris paribus?
Shukri Reply
other things being equal
AI-Robot
When MP₁ becomes negative, TP start to decline. Extuples Suppose that the short-run production function of certain cut-flower firm is given by: Q=4KL-0.6K2 - 0.112 • Where is quantity of cut flower produced, I is labour input and K is fixed capital input (K-5). Determine the average product of lab
Kelo
Extuples Suppose that the short-run production function of certain cut-flower firm is given by: Q=4KL-0.6K2 - 0.112 • Where is quantity of cut flower produced, I is labour input and K is fixed capital input (K-5). Determine the average product of labour (APL) and marginal product of labour (MPL)
Kelo
yes,thank you
Shukri
Can I ask you other question?
Shukri
what is monopoly mean?
Habtamu Reply
What is different between quantity demand and demand?
Shukri Reply
Quantity demanded refers to the specific amount of a good or service that consumers are willing and able to purchase at a give price and within a specific time period. Demand, on the other hand, is a broader concept that encompasses the entire relationship between price and quantity demanded
Ezea
ok
Shukri
how do you save a country economic situation when it's falling apart
Lilia Reply
what is the difference between economic growth and development
Fiker Reply
Economic growth as an increase in the production and consumption of goods and services within an economy.but Economic development as a broader concept that encompasses not only economic growth but also social & human well being.
Shukri
production function means
Jabir
What do you think is more important to focus on when considering inequality ?
Abdisa Reply
any question about economics?
Awais Reply
sir...I just want to ask one question... Define the term contract curve? if you are free please help me to find this answer 🙏
Asui
it is a curve that we get after connecting the pareto optimal combinations of two consumers after their mutually beneficial trade offs
Awais
thank you so much 👍 sir
Asui
In economics, the contract curve refers to the set of points in an Edgeworth box diagram where both parties involved in a trade cannot be made better off without making one of them worse off. It represents the Pareto efficient allocations of goods between two individuals or entities, where neither p
Cornelius
In economics, the contract curve refers to the set of points in an Edgeworth box diagram where both parties involved in a trade cannot be made better off without making one of them worse off. It represents the Pareto efficient allocations of goods between two individuals or entities,
Cornelius
Suppose a consumer consuming two commodities X and Y has The following utility function u=X0.4 Y0.6. If the price of the X and Y are 2 and 3 respectively and income Constraint is birr 50. A,Calculate quantities of x and y which maximize utility. B,Calculate value of Lagrange multiplier. C,Calculate quantities of X and Y consumed with a given price. D,alculate optimum level of output .
Feyisa Reply
Answer
Feyisa
c
Jabir
the market for lemon has 10 potential consumers, each having an individual demand curve p=101-10Qi, where p is price in dollar's per cup and Qi is the number of cups demanded per week by the i th consumer.Find the market demand curve using algebra. Draw an individual demand curve and the market dema
Gsbwnw Reply
suppose the production function is given by ( L, K)=L¼K¾.assuming capital is fixed find APL and MPL. consider the following short run production function:Q=6L²-0.4L³ a) find the value of L that maximizes output b)find the value of L that maximizes marginal product
Abdureman
types of unemployment
Yomi Reply
What is the difference between perfect competition and monopolistic competition?
Mohammed
Got questions? Join the online conversation and get instant answers!
Jobilize.com Reply

Get Jobilize Job Search Mobile App in your pocket Now!

Get it on Google Play Download on the App Store Now


Source:  OpenStax, Biology. OpenStax CNX. Feb 29, 2016 Download for free at http://cnx.org/content/col11448/1.10
Google Play and the Google Play logo are trademarks of Google Inc.

Notification Switch

Would you like to follow the 'Biology' conversation and receive update notifications?

Ask