<< Chapter < Page Chapter >> Page >

Community dynamics

Community dynamics are the changes in community structure and composition over time. Sometimes these changes are induced by environmental disturbances such as volcanoes, earthquakes, storms, fires, and climate change. Communities with a stable structure are said to be at equilibrium. Following a disturbance, the community may or may not return to the equilibrium state.

Succession describes the sequential appearance and disappearance of species in a community over time. In primary succession    , newly exposed or newly formed land is colonized by living things; in secondary succession    , part of an ecosystem is disturbed and remnants of the previous community remain.

Primary succession and pioneer species

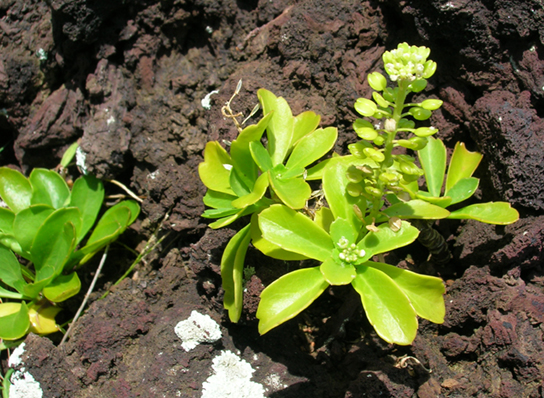
Primary succession occurs when new land is formed or rock is exposed: for example, following the eruption of volcanoes, such as those on the Big Island of Hawaii. As lava flows into the ocean, new land is continually being formed. On the Big Island, approximately 32 acres of land is added each year. First, weathering and other natural forces break down the substrate enough for the establishment of certain hearty plants and lichens with few soil requirements, known as pioneer species    ( [link] ). These species help to further break down the mineral rich lava into soil where other, less hardy species will grow and eventually replace the pioneer species. In addition, as these early species grow and die, they add to an ever-growing layer of decomposing organic material and contribute to soil formation. Over time the area will reach an equilibrium state, with a set of organisms quite different from the pioneer species.

Photo shows a succulent plant growing in bare earth.
During primary succession in lava on Maui, Hawaii, succulent plants are the pioneer species. (credit: Forest and Kim Starr)

Secondary succession

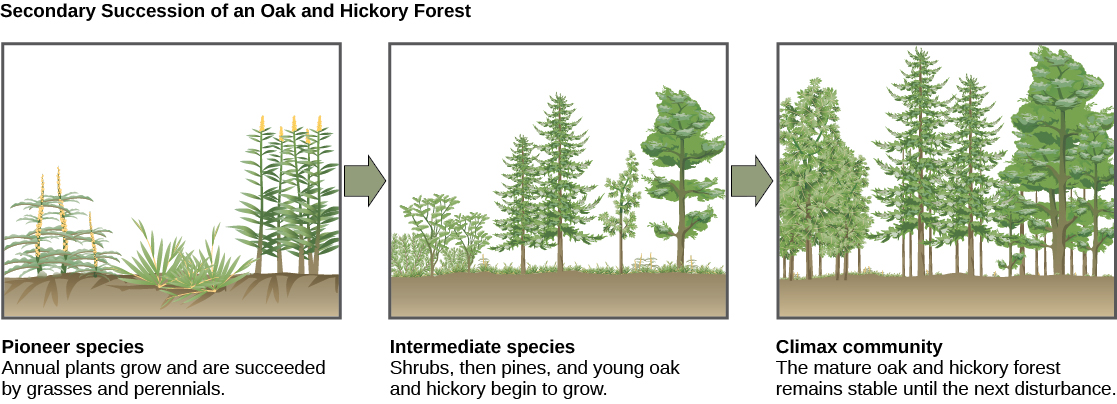
A classic example of secondary succession occurs in oak and hickory forests cleared by wildfire ( [link] ). Wildfires will burn most vegetation and kill those animals unable to flee the area. Their nutrients, however, are returned to the ground in the form of ash. Thus, even when areas are devoid of life due to severe fires, the area will soon be ready for new life to take hold.

Before the fire, the vegetation was dominated by tall trees with access to the major plant energy resource: sunlight. Their height gave them access to sunlight while also shading the ground and other low-lying species. After the fire, though, these trees are no longer dominant. Thus, the first plants to grow back are usually annual plants followed within a few years by quickly growing and spreading grasses and other pioneer species. Due to, at least in part, changes in the environment brought on by the growth of the grasses and other species, over many years, shrubs will emerge along with small pine, oak, and hickory trees. These organisms are called intermediate species. Eventually, over 150 years, the forest will reach its equilibrium point where species composition is no longer changing and resembles the community before the fire. This equilibrium state is referred to as the climax community    , which will remain stable until the next disturbance.

The three illustrations show secondary succession of an oak and hickory forest. The first illustration shows a plot of land covered with pioneer species, including grasses and perennials. The second illustration shows the same plot of land later covered with intermediate species, including shrubs, pines, oak, and hickory. The third illustration shows the plot of land covered with a climax community of mature oak and hickory. This community remains stable until the next disturbance.
Secondary succession is shown in an oak and hickory forest after a forest fire.

Section summary

Communities include all the different species living in a given area. The variety of these species is called species richness. Many organisms have developed defenses against predation and herbivory, including mechanical defenses, warning coloration, and mimicry, as a result of evolution and the interaction with other members of the community. Two species cannot exist in the same habitat competing directly for the same resources. Species may form symbiotic relationships such as commensalism or mutualism. Community structure is described by its foundation and keystone species. Communities respond to environmental disturbances by succession (the predictable appearance of different types of plant species) until a stable community structure is established.

Questions & Answers

differentiate between demand and supply giving examples
Lambiv Reply
differentiated between demand and supply using examples
Lambiv
what is labour ?
Lambiv
how will I do?
Venny Reply
how is the graph works?I don't fully understand
Rezat Reply
information
Eliyee
devaluation
Eliyee
t
WARKISA
hi guys good evening to all
Lambiv
multiple choice question
Aster Reply
appreciation
Eliyee
explain perfect market
Lindiwe Reply
In economics, a perfect market refers to a theoretical construct where all participants have perfect information, goods are homogenous, there are no barriers to entry or exit, and prices are determined solely by supply and demand. It's an idealized model used for analysis,
Ezea
What is ceteris paribus?
Shukri Reply
other things being equal
AI-Robot
When MP₁ becomes negative, TP start to decline. Extuples Suppose that the short-run production function of certain cut-flower firm is given by: Q=4KL-0.6K2 - 0.112 • Where is quantity of cut flower produced, I is labour input and K is fixed capital input (K-5). Determine the average product of lab
Kelo
Extuples Suppose that the short-run production function of certain cut-flower firm is given by: Q=4KL-0.6K2 - 0.112 • Where is quantity of cut flower produced, I is labour input and K is fixed capital input (K-5). Determine the average product of labour (APL) and marginal product of labour (MPL)
Kelo
yes,thank you
Shukri
Can I ask you other question?
Shukri
what is monopoly mean?
Habtamu Reply
What is different between quantity demand and demand?
Shukri Reply
Quantity demanded refers to the specific amount of a good or service that consumers are willing and able to purchase at a give price and within a specific time period. Demand, on the other hand, is a broader concept that encompasses the entire relationship between price and quantity demanded
Ezea
ok
Shukri
how do you save a country economic situation when it's falling apart
Lilia Reply
what is the difference between economic growth and development
Fiker Reply
Economic growth as an increase in the production and consumption of goods and services within an economy.but Economic development as a broader concept that encompasses not only economic growth but also social & human well being.
Shukri
production function means
Jabir
What do you think is more important to focus on when considering inequality ?
Abdisa Reply
any question about economics?
Awais Reply
sir...I just want to ask one question... Define the term contract curve? if you are free please help me to find this answer 🙏
Asui
it is a curve that we get after connecting the pareto optimal combinations of two consumers after their mutually beneficial trade offs
Awais
thank you so much 👍 sir
Asui
In economics, the contract curve refers to the set of points in an Edgeworth box diagram where both parties involved in a trade cannot be made better off without making one of them worse off. It represents the Pareto efficient allocations of goods between two individuals or entities, where neither p
Cornelius
In economics, the contract curve refers to the set of points in an Edgeworth box diagram where both parties involved in a trade cannot be made better off without making one of them worse off. It represents the Pareto efficient allocations of goods between two individuals or entities,
Cornelius
Suppose a consumer consuming two commodities X and Y has The following utility function u=X0.4 Y0.6. If the price of the X and Y are 2 and 3 respectively and income Constraint is birr 50. A,Calculate quantities of x and y which maximize utility. B,Calculate value of Lagrange multiplier. C,Calculate quantities of X and Y consumed with a given price. D,alculate optimum level of output .
Feyisa Reply
Answer
Feyisa
c
Jabir
the market for lemon has 10 potential consumers, each having an individual demand curve p=101-10Qi, where p is price in dollar's per cup and Qi is the number of cups demanded per week by the i th consumer.Find the market demand curve using algebra. Draw an individual demand curve and the market dema
Gsbwnw Reply
suppose the production function is given by ( L, K)=L¼K¾.assuming capital is fixed find APL and MPL. consider the following short run production function:Q=6L²-0.4L³ a) find the value of L that maximizes output b)find the value of L that maximizes marginal product
Abdureman
types of unemployment
Yomi Reply
What is the difference between perfect competition and monopolistic competition?
Mohammed
Got questions? Join the online conversation and get instant answers!
Jobilize.com Reply

Get Jobilize Job Search Mobile App in your pocket Now!

Get it on Google Play Download on the App Store Now


Source:  OpenStax, Biology. OpenStax CNX. Feb 29, 2016 Download for free at http://cnx.org/content/col11448/1.10
Google Play and the Google Play logo are trademarks of Google Inc.

Notification Switch

Would you like to follow the 'Biology' conversation and receive update notifications?

Ask