<< Chapter < Page Chapter >> Page >

Art connection

For the four different age structure diagrams shown, the base represents birth and the apex occurs around age 70. The age structure diagram for stage 1, rapid growth, is shaped like a deflated triangle that starts out wide at the base and rapidly decreases to a narrow apex, indicating that the number of individuals decreases rapidly with age. The age structure diagram for stage 2, slow growth, is triangular in shape, indicating that the number of individuals decreases steadily with age. The age structure diagram for stage 3, stable growth, is rounded at the top, indicating that the number of individuals per age group decreases gradually at first, then increases for the older portion of the population. The final age structure diagram, stage 4, widens from the base to middle age, and then narrows to a rounded top. The population type indicated by this diagram is not given, as this is part of the art connection question.
Typical age structure diagrams are shown. The rapid growth diagram narrows to a point, indicating that the number of individuals decreases rapidly with age. In the slow growth model, the number of individuals decreases steadily with age. Stable population diagrams are rounded on the top, showing that the number of individuals per age group decreases gradually, and then increases for the older part of the population.

Age structure diagrams for rapidly growing, slow growing and stable populations are shown in stages 1 through 3. What type of population change do you think stage 4 represents?
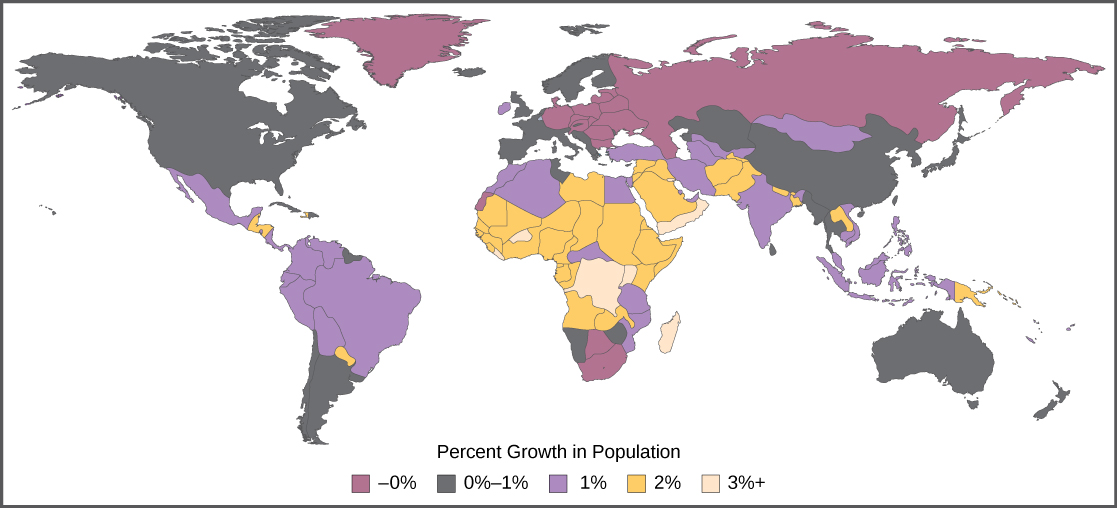
Percent population growth, which ranges from zero percent to three plus percent, is shown on a world map. Europe, Northern Asia, Greenland and South Africa are experiencing zero percent population growth. The United States, Canada, the southern part of South America, China, and Australia are experiencing zero to one percent population growth. Mexico, the northern part of South America, and parts of Africa, the Middle East and Asia are experiencing one percent population growth. Most of Africa and parts of the Middle East and Asia are experiencing two percent population growth. Some parts of Africa are experiencing three percent population growth.
The percent growth rate of population in different countries is shown. Notice that the highest growth is occurring in less economically developed countries in Africa and Asia.

Long-term consequences of exponential human population growth

Many dire predictions have been made about the world’s population leading to a major crisis called the “population explosion.” In the 1968 book The Population Bomb , biologist Dr. Paul R. Ehrlich wrote, “The battle to feed all of humanity is over. In the 1970s hundreds of millions of people will starve to death in spite of any crash programs embarked upon now. At this late date nothing can prevent a substantial increase in the world death rate.” Paul R. Erlich, prologue to The Population Bomb , (1968; repr., New York: Ballantine, 1970). While many critics view this statement as an exaggeration, the laws of exponential population growth are still in effect, and unchecked human population growth cannot continue indefinitely.

Efforts to control population growth led to the one-child policy    in China, which used to include more severe consequences, but now imposes fines on urban couples who have more than one child. Due to the fact that some couples wish to have a male heir, many Chinese couples continue to have more than one child. The policy itself, its social impacts, and the effectiveness of limiting overall population growth are controversial. In spite of population control policies, the human population continues to grow. At some point the food supply may run out because of the subsequent need to produce more and more food to feed our population. The United Nations estimates that future world population growth may vary from 6 billion (a decrease) to 16 billion people by the year 2100. There is no way to know whether human population growth will moderate to the point where the crisis described by Dr. Ehrlich will be averted.

Another result of population growth is the endangerment of the natural environment. Many countries have attempted to reduce the human impact on climate change by reducing their emission of the greenhouse gas carbon dioxide. However, these treaties have not been ratified by every country, and many underdeveloped countries trying to improve their economic condition may be less likely to agree with such provisions if it means slower economic development. Furthermore, the role of human activity in causing climate change has become a hotly debated socio-political issue in some developed countries, including the United States. Thus, we enter the future with considerable uncertainty about our ability to curb human population growth and protect our environment.

Visit this website and select “Launch movie” for an animation discussing the global impacts of human population growth.

Section summary

The world’s human population is growing at an exponential rate. Humans have increased the world’s carrying capacity through migration, agriculture, medical advances, and communication. The age structure of a population allows us to predict population growth. Unchecked human population growth could have dire long-term effects on our environment.

Art connections

[link] Age structure diagrams for rapidly growing, slow growing and stable populations are shown in stages 1 through 3. What type of population change do you think stage 4 represents?

[link] Stage 4 represents a population that is decreasing.

Got questions? Get instant answers now!

Questions & Answers

What are the factors that affect demand for a commodity
Florence Reply
differentiate between demand and supply giving examples
Lambiv Reply
differentiated between demand and supply using examples
Lambiv
what is labour ?
Lambiv
how will I do?
Venny Reply
how is the graph works?I don't fully understand
Rezat Reply
information
Eliyee
devaluation
Eliyee
t
WARKISA
hi guys good evening to all
Lambiv
multiple choice question
Aster Reply
appreciation
Eliyee
explain perfect market
Lindiwe Reply
In economics, a perfect market refers to a theoretical construct where all participants have perfect information, goods are homogenous, there are no barriers to entry or exit, and prices are determined solely by supply and demand. It's an idealized model used for analysis,
Ezea
What is ceteris paribus?
Shukri Reply
other things being equal
AI-Robot
When MP₁ becomes negative, TP start to decline. Extuples Suppose that the short-run production function of certain cut-flower firm is given by: Q=4KL-0.6K2 - 0.112 • Where is quantity of cut flower produced, I is labour input and K is fixed capital input (K-5). Determine the average product of lab
Kelo
Extuples Suppose that the short-run production function of certain cut-flower firm is given by: Q=4KL-0.6K2 - 0.112 • Where is quantity of cut flower produced, I is labour input and K is fixed capital input (K-5). Determine the average product of labour (APL) and marginal product of labour (MPL)
Kelo
yes,thank you
Shukri
Can I ask you other question?
Shukri
what is monopoly mean?
Habtamu Reply
What is different between quantity demand and demand?
Shukri Reply
Quantity demanded refers to the specific amount of a good or service that consumers are willing and able to purchase at a give price and within a specific time period. Demand, on the other hand, is a broader concept that encompasses the entire relationship between price and quantity demanded
Ezea
ok
Shukri
how do you save a country economic situation when it's falling apart
Lilia Reply
what is the difference between economic growth and development
Fiker Reply
Economic growth as an increase in the production and consumption of goods and services within an economy.but Economic development as a broader concept that encompasses not only economic growth but also social & human well being.
Shukri
production function means
Jabir
What do you think is more important to focus on when considering inequality ?
Abdisa Reply
any question about economics?
Awais Reply
sir...I just want to ask one question... Define the term contract curve? if you are free please help me to find this answer 🙏
Asui
it is a curve that we get after connecting the pareto optimal combinations of two consumers after their mutually beneficial trade offs
Awais
thank you so much 👍 sir
Asui
In economics, the contract curve refers to the set of points in an Edgeworth box diagram where both parties involved in a trade cannot be made better off without making one of them worse off. It represents the Pareto efficient allocations of goods between two individuals or entities, where neither p
Cornelius
In economics, the contract curve refers to the set of points in an Edgeworth box diagram where both parties involved in a trade cannot be made better off without making one of them worse off. It represents the Pareto efficient allocations of goods between two individuals or entities,
Cornelius
Suppose a consumer consuming two commodities X and Y has The following utility function u=X0.4 Y0.6. If the price of the X and Y are 2 and 3 respectively and income Constraint is birr 50. A,Calculate quantities of x and y which maximize utility. B,Calculate value of Lagrange multiplier. C,Calculate quantities of X and Y consumed with a given price. D,alculate optimum level of output .
Feyisa Reply
Answer
Feyisa
c
Jabir
the market for lemon has 10 potential consumers, each having an individual demand curve p=101-10Qi, where p is price in dollar's per cup and Qi is the number of cups demanded per week by the i th consumer.Find the market demand curve using algebra. Draw an individual demand curve and the market dema
Gsbwnw Reply
suppose the production function is given by ( L, K)=L¼K¾.assuming capital is fixed find APL and MPL. consider the following short run production function:Q=6L²-0.4L³ a) find the value of L that maximizes output b)find the value of L that maximizes marginal product
Abdureman
Got questions? Join the online conversation and get instant answers!
Jobilize.com Reply

Get Jobilize Job Search Mobile App in your pocket Now!

Get it on Google Play Download on the App Store Now


Source:  OpenStax, Biology. OpenStax CNX. Feb 29, 2016 Download for free at http://cnx.org/content/col11448/1.10
Google Play and the Google Play logo are trademarks of Google Inc.

Notification Switch

Would you like to follow the 'Biology' conversation and receive update notifications?

Ask