<< Chapter < Page Chapter >> Page >

Conceptual models

Conceptual models are useful for describing ecosystem structure and dynamics and for demonstrating the relationships between different organisms in a community and their environment. Conceptual models are usually depicted graphically as flow charts. The organisms and their resources are grouped into specific compartments with arrows showing the relationship and transfer of energy or nutrients between them. Thus, these diagrams are sometimes called compartment models.

To model the cycling of mineral nutrients, organic and inorganic nutrients are subdivided into those that are bioavailable (ready to be incorporated into biological macromolecules) and those that are not. For example, in a terrestrial ecosystem near a deposit of coal, carbon will be available to the plants of this ecosystem as carbon dioxide gas in a short-term period, not from the carbon-rich coal itself. However, over a longer period, microorganisms capable of digesting coal will incorporate its carbon or release it as natural gas (methane, CH 4 ), changing this unavailable organic source into an available one. This conversion is greatly accelerated by the combustion of fossil fuels by humans, which releases large amounts of carbon dioxide into the atmosphere. This is thought to be a major factor in the rise of the atmospheric carbon dioxide levels in the industrial age. The carbon dioxide released from burning fossil fuels is produced faster than photosynthetic organisms can use it. This process is intensified by the reduction of photosynthetic trees because of worldwide deforestation. Most scientists agree that high atmospheric carbon dioxide is a major cause of global climate change.

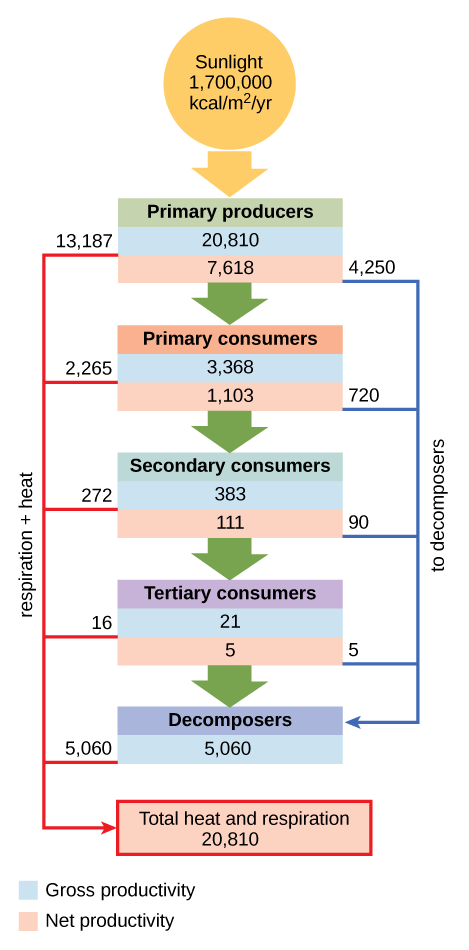
Conceptual models are also used to show the flow of energy through particular ecosystems. [link] is based on Howard T. Odum’s classical study of the Silver Springs, Florida, holistic ecosystem in the mid-twentieth century. Howard T. Odum, “Trophic Structure and Productivity of Silver Springs, Florida,” Ecological Monographs 27, no. 1 (1957): 47–112. This study shows the energy content and transfer between various ecosystem compartments.
Art connection

 Flow chart shows that the ecosystem absorbs 1,700,00 calories per meter squared per year of sunlight. Primary producers have a gross productivity of 20,810 calories per meter squared per year. 13,187 calories per meter squared per year is lost to respiration and heat, so the net productivity of primary producers is 7,618 calories per meter squared per year. 4,250 calories per meter squared per year is passed on to decomposers, and the remaining 3,368 calories per meter squared per year is passed on to primary consumers. Thus, the gross productivity of primary consumers is 3,368 calories per meter squared per year. 2,265 calories per meter squared per year is lost to heat and respiration, resulting in a net productivity for primary consumers of 1,103 calories per meter squared per year. 720 calories per meter squared per year is lost to decomposers, and 383 calories per meter squared per year becomes the gross productivity of secondary consumers. 272 calories per meter squared per year is lost to heat and respiration, so the net productivity for secondary consumers is 111 calories per meter squared per year. 90 calories per meter squared per year is lost to decomposers, and the remaining 21 calories per meter squared per year becomes the gross productivity of tertiary consumers. Sixteen calories per meter squared per year is lost to respiration and heat, so the net productivity of tertiary consumers is 5 calories per meter squared per year. All this energy is lost to decomposers. In total, decomposers use 5,060 calories per meter squared per year of energy, and 20,810 calories per meter squared per year is lost to respiration and heat.
This conceptual model shows the flow of energy through a spring ecosystem in Silver Springs, Florida. Notice that the energy decreases with each increase in trophic level.

Why do you think the value for gross productivity of the primary producers is the same as the value for total heat and respiration (20,810 kcal/m 2 /yr)?

Analytical and simulation models

The major limitation of conceptual models is their inability to predict the consequences of changes in ecosystem species and/or environment. Ecosystems are dynamic entities and subject to a variety of abiotic and biotic disturbances caused by natural forces and/or human activity. Ecosystems altered from their initial equilibrium state can often recover from such disturbances and return to a state of equilibrium. As most ecosystems are subject to periodic disturbances and are often in a state of change, they are usually either moving toward or away from their equilibrium state. There are many of these equilibrium states among the various components of an ecosystem, which affects the ecosystem overall. Furthermore, as humans have the ability to greatly and rapidly alter the species content and habitat of an ecosystem, the need for predictive models that enable understanding of how ecosystems respond to these changes becomes more crucial.

Analytical models often use simple, linear components of ecosystems, such as food chains, and are known to be complex mathematically; therefore, they require a significant amount of mathematical knowledge and expertise. Although analytical models have great potential, their simplification of complex ecosystems is thought to limit their accuracy. Simulation models that use computer programs are better able to deal with the complexities of ecosystem structure.

A recent development in simulation modeling uses supercomputers to create and run individual-based simulations, which accounts for the behavior of individual organisms and their effects on the ecosystem as a whole. These simulations are considered to be the most accurate and predictive of the complex responses of ecosystems to disturbances.

Visit The Darwin Project to view a variety of ecosystem models.

Section summary

Ecosystems exist on land, at sea, in the air, and underground. Different ways of modeling ecosystems are necessary to understand how environmental disturbances will affect ecosystem structure and dynamics. Conceptual models are useful to show the general relationships between organisms and the flow of materials or energy between them. Analytical models are used to describe linear food chains, and simulation models work best with holistic food webs.

Art connections

[link] Why do you think the value for gross productivity of the primary producers is the same as the value for total heat and respiration (20,810 kcal/m 2 /yr)?

[link] According to the first law of thermodynamics, energy can neither be created nor destroyed. Eventually, all energy consumed by living systems is lost as heat or used for respiration, and the total energy output of the system must equal the energy that went into it.

Got questions? Get instant answers now!

Questions & Answers

differentiate between demand and supply giving examples
Lambiv Reply
differentiated between demand and supply using examples
Lambiv
what is labour ?
Lambiv
how will I do?
Venny Reply
how is the graph works?I don't fully understand
Rezat Reply
information
Eliyee
devaluation
Eliyee
t
WARKISA
hi guys good evening to all
Lambiv
multiple choice question
Aster Reply
appreciation
Eliyee
explain perfect market
Lindiwe Reply
In economics, a perfect market refers to a theoretical construct where all participants have perfect information, goods are homogenous, there are no barriers to entry or exit, and prices are determined solely by supply and demand. It's an idealized model used for analysis,
Ezea
What is ceteris paribus?
Shukri Reply
other things being equal
AI-Robot
When MP₁ becomes negative, TP start to decline. Extuples Suppose that the short-run production function of certain cut-flower firm is given by: Q=4KL-0.6K2 - 0.112 • Where is quantity of cut flower produced, I is labour input and K is fixed capital input (K-5). Determine the average product of lab
Kelo
Extuples Suppose that the short-run production function of certain cut-flower firm is given by: Q=4KL-0.6K2 - 0.112 • Where is quantity of cut flower produced, I is labour input and K is fixed capital input (K-5). Determine the average product of labour (APL) and marginal product of labour (MPL)
Kelo
yes,thank you
Shukri
Can I ask you other question?
Shukri
what is monopoly mean?
Habtamu Reply
What is different between quantity demand and demand?
Shukri Reply
Quantity demanded refers to the specific amount of a good or service that consumers are willing and able to purchase at a give price and within a specific time period. Demand, on the other hand, is a broader concept that encompasses the entire relationship between price and quantity demanded
Ezea
ok
Shukri
how do you save a country economic situation when it's falling apart
Lilia Reply
what is the difference between economic growth and development
Fiker Reply
Economic growth as an increase in the production and consumption of goods and services within an economy.but Economic development as a broader concept that encompasses not only economic growth but also social & human well being.
Shukri
production function means
Jabir
What do you think is more important to focus on when considering inequality ?
Abdisa Reply
any question about economics?
Awais Reply
sir...I just want to ask one question... Define the term contract curve? if you are free please help me to find this answer 🙏
Asui
it is a curve that we get after connecting the pareto optimal combinations of two consumers after their mutually beneficial trade offs
Awais
thank you so much 👍 sir
Asui
In economics, the contract curve refers to the set of points in an Edgeworth box diagram where both parties involved in a trade cannot be made better off without making one of them worse off. It represents the Pareto efficient allocations of goods between two individuals or entities, where neither p
Cornelius
In economics, the contract curve refers to the set of points in an Edgeworth box diagram where both parties involved in a trade cannot be made better off without making one of them worse off. It represents the Pareto efficient allocations of goods between two individuals or entities,
Cornelius
Suppose a consumer consuming two commodities X and Y has The following utility function u=X0.4 Y0.6. If the price of the X and Y are 2 and 3 respectively and income Constraint is birr 50. A,Calculate quantities of x and y which maximize utility. B,Calculate value of Lagrange multiplier. C,Calculate quantities of X and Y consumed with a given price. D,alculate optimum level of output .
Feyisa Reply
Answer
Feyisa
c
Jabir
the market for lemon has 10 potential consumers, each having an individual demand curve p=101-10Qi, where p is price in dollar's per cup and Qi is the number of cups demanded per week by the i th consumer.Find the market demand curve using algebra. Draw an individual demand curve and the market dema
Gsbwnw Reply
suppose the production function is given by ( L, K)=L¼K¾.assuming capital is fixed find APL and MPL. consider the following short run production function:Q=6L²-0.4L³ a) find the value of L that maximizes output b)find the value of L that maximizes marginal product
Abdureman
types of unemployment
Yomi Reply
What is the difference between perfect competition and monopolistic competition?
Mohammed
Got questions? Join the online conversation and get instant answers!
Jobilize.com Reply

Get Jobilize Job Search Mobile App in your pocket Now!

Get it on Google Play Download on the App Store Now


Source:  OpenStax, Biology. OpenStax CNX. Feb 29, 2016 Download for free at http://cnx.org/content/col11448/1.10
Google Play and the Google Play logo are trademarks of Google Inc.

Notification Switch

Would you like to follow the 'Biology' conversation and receive update notifications?

Ask