<< Chapter < Page
  Biology   Page 1 / 1
Chapter >> Page >
Left photo shows a long, straight highway in the middle of a desert. Right photo shows a mouse.
In the southwestern United States, rainy weather causes an increase in production of pinyon nuts, causing the deer mouse population to explode. Deer mice may carry a virus called Sin Nombre (a hantavirus) that causes respiratory disease in humans and has a high fatality rate. In 1992–1993, wet El Niño weather caused a Sin Nombre epidemic. Navajo healers, who were aware of the link between this disease and weather, predicted the outbreak. (credit "highway": modification of work by Phillip Capper; credit "mouse": modification of work by USFWS)

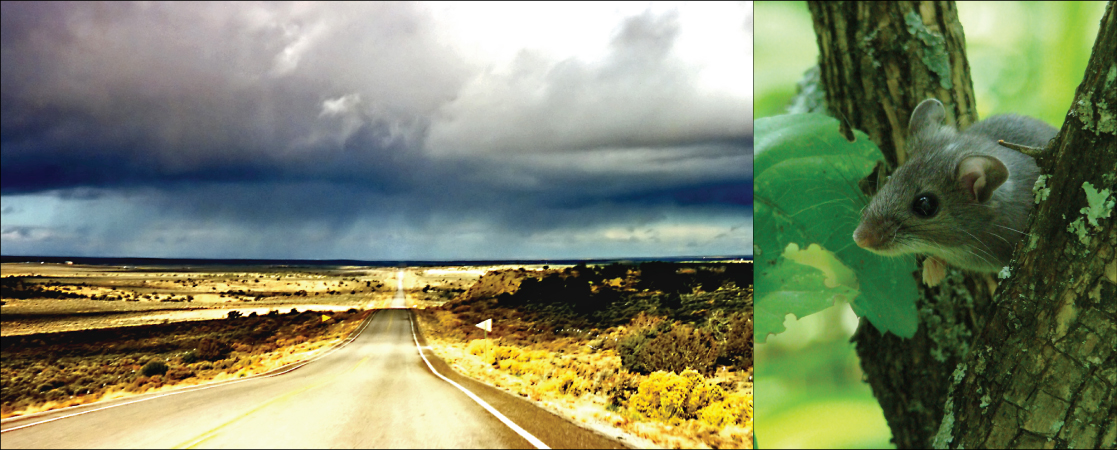
In 1993, an interesting example of ecosystem dynamics occurred when a rare lung disease struck inhabitants of the southwestern United States. This disease had an alarming rate of fatalities, killing more than half of early patients, many of whom were Native Americans. These formerly healthy young adults died from complete respiratory failure. The disease was unknown, and the Centers for Disease Control (CDC), the United States government agency responsible for managing potential epidemics, was brought in to investigate. The scientists could have learned about the disease had they known to talk with the Navajo healers who lived in the area and who had observed the connection between rainfall and mice populations, thereby predicting the 1993 outbreak.

The cause of the disease, determined within a few weeks by the CDC investigators, was the hantavirus known as Sin Nombre , the virus with “no name.” With insights from traditional Navajo medicine, scientists were able to characterize the disease rapidly and institute effective health measures to prevent its spread. This example illustrates the importance of understanding the complexities of ecosystems and how they respond to changes in the environment.

Questions & Answers

how do you get the 2/50
Abba Reply
number of sport play by 50 student construct discrete data
Aminu Reply
width of the frangebany leaves on how to write a introduction
Theresa Reply
Solve the mean of variance
Veronica Reply
Step 1: Find the mean. To find the mean, add up all the scores, then divide them by the number of scores. ... Step 2: Find each score's deviation from the mean. ... Step 3: Square each deviation from the mean. ... Step 4: Find the sum of squares. ... Step 5: Divide the sum of squares by n – 1 or N.
kenneth
what is error
Yakuba Reply
Is mistake done to something
Vutshila
Hy
anas
hy
What is the life teble
anas
hy
Jibrin
statistics is the analyzing of data
Tajudeen Reply
what is statics?
Zelalem Reply
how do you calculate mean
Gloria Reply
diveving the sum if all values
Shaynaynay
let A1,A2 and A3 events be independent,show that (A1)^c, (A2)^c and (A3)^c are independent?
Fisaye Reply
what is statistics
Akhisani Reply
data collected all over the world
Shaynaynay
construct a less than and more than table
Imad Reply
The sample of 16 students is taken. The average age in the sample was 22 years with astandard deviation of 6 years. Construct a 95% confidence interval for the age of the population.
Aschalew Reply
Bhartdarshan' is an internet-based travel agency wherein customer can see videos of the cities they plant to visit. The number of hits daily is a normally distributed random variable with a mean of 10,000 and a standard deviation of 2,400 a. what is the probability of getting more than 12,000 hits? b. what is the probability of getting fewer than 9,000 hits?
Akshay Reply
Bhartdarshan'is an internet-based travel agency wherein customer can see videos of the cities they plan to visit. The number of hits daily is a normally distributed random variable with a mean of 10,000 and a standard deviation of 2,400. a. What is the probability of getting more than 12,000 hits
Akshay
1
Bright
Sorry i want to learn more about this question
Bright
Someone help
Bright
a= 0.20233 b=0.3384
Sufiyan
a
Shaynaynay
How do I interpret level of significance?
Mohd Reply
It depends on your business problem or in Machine Learning you could use ROC- AUC cruve to decide the threshold value
Shivam
how skewness and kurtosis are used in statistics
Owen Reply
yes what is it
Taneeya
Got questions? Join the online conversation and get instant answers!
Jobilize.com Reply

Get Jobilize Job Search Mobile App in your pocket Now!

Get it on Google Play Download on the App Store Now


Source:  OpenStax, Biology. OpenStax CNX. Feb 29, 2016 Download for free at http://cnx.org/content/col11448/1.10
Google Play and the Google Play logo are trademarks of Google Inc.

Notification Switch

Would you like to follow the 'Biology' conversation and receive update notifications?

Ask