<< Chapter < Page
  Biology   Page 1 / 1
Chapter >> Page >
 Photo (a) shows a deer tick on a leaf. The tick has a brown oval body with a smaller, round oval toward the front. The head and legs are black. Photo (b) shows an arm with a red, circular rash enclosed in a ring-like rash. Photo (c) shows a brown mouse with a white belly and legs and large, round ears.
The (a) deer tick carries the bacterium that produces Lyme disease in humans, often evident in (b) a symptomatic bull’s eye rash. The (c) white-footed mouse is one well-known host to deer ticks carrying the Lyme disease bacterium. (credit a: modification of work by Scott Bauer, USDA ARS; credit b: modification of work by James Gathany, CDC; credit c: modification of work by Rob Ireton)

Why study ecology? Perhaps you are interested in learning about the natural world and how living things have adapted to the physical conditions of their environment. Or, perhaps you’re a future physician seeking to understand the connection between human health and ecology.

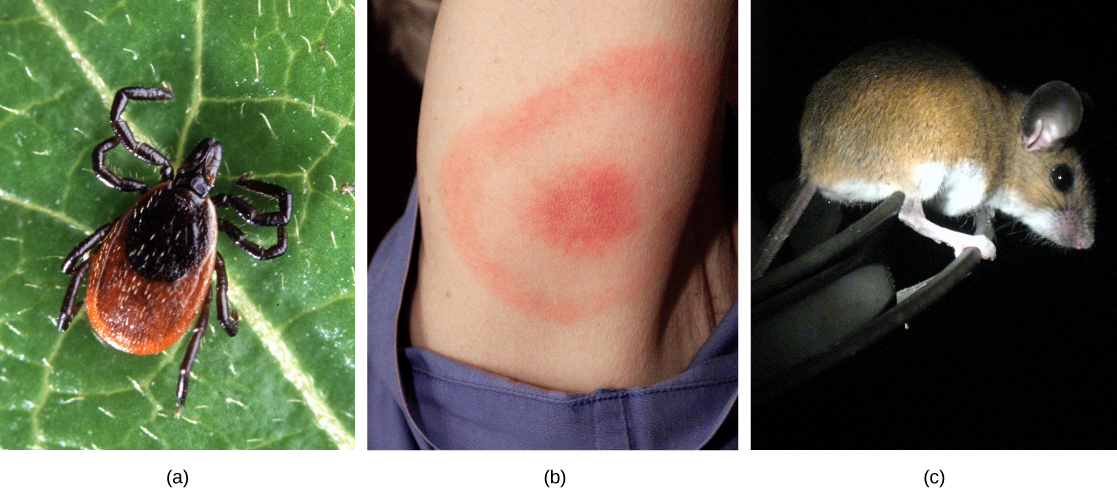
Humans are a part of the ecological landscape, and human health is one important part of human interaction with our physical and living environment. Lyme disease, for instance, serves as one modern-day example of the connection between our health and the natural world ( [link] ). More formally known as Lyme borreliosis, Lyme disease is a bacterial infection that can be transmitted to humans when they are bitten by the deer tick ( Ixodes scapularis ), which is the primary vector for this disease. However, not all deer ticks carry the bacteria that will cause Lyme disease in humans, and I. scapularis can have other hosts besides deer. In fact, it turns out that the probability of infection depends on the type of host upon which the tick develops: a higher proportion of ticks that live on white-footed mice carry the bacterium than do ticks that live on deer. Knowledge about the environments and population densities in which the host species is abundant would help a physician or an epidemiologist better understand how Lyme disease is transmitted and how its incidence could be reduced.

Questions & Answers

how do you get the 2/50
Abba Reply
number of sport play by 50 student construct discrete data
Aminu Reply
width of the frangebany leaves on how to write a introduction
Theresa Reply
Solve the mean of variance
Veronica Reply
Step 1: Find the mean. To find the mean, add up all the scores, then divide them by the number of scores. ... Step 2: Find each score's deviation from the mean. ... Step 3: Square each deviation from the mean. ... Step 4: Find the sum of squares. ... Step 5: Divide the sum of squares by n – 1 or N.
kenneth
what is error
Yakuba Reply
Is mistake done to something
Vutshila
Hy
anas
hy
What is the life teble
anas
hy
Jibrin
statistics is the analyzing of data
Tajudeen Reply
what is statics?
Zelalem Reply
how do you calculate mean
Gloria Reply
diveving the sum if all values
Shaynaynay
let A1,A2 and A3 events be independent,show that (A1)^c, (A2)^c and (A3)^c are independent?
Fisaye Reply
what is statistics
Akhisani Reply
data collected all over the world
Shaynaynay
construct a less than and more than table
Imad Reply
The sample of 16 students is taken. The average age in the sample was 22 years with astandard deviation of 6 years. Construct a 95% confidence interval for the age of the population.
Aschalew Reply
Bhartdarshan' is an internet-based travel agency wherein customer can see videos of the cities they plant to visit. The number of hits daily is a normally distributed random variable with a mean of 10,000 and a standard deviation of 2,400 a. what is the probability of getting more than 12,000 hits? b. what is the probability of getting fewer than 9,000 hits?
Akshay Reply
Bhartdarshan'is an internet-based travel agency wherein customer can see videos of the cities they plan to visit. The number of hits daily is a normally distributed random variable with a mean of 10,000 and a standard deviation of 2,400. a. What is the probability of getting more than 12,000 hits
Akshay
1
Bright
Sorry i want to learn more about this question
Bright
Someone help
Bright
a= 0.20233 b=0.3384
Sufiyan
a
Shaynaynay
How do I interpret level of significance?
Mohd Reply
It depends on your business problem or in Machine Learning you could use ROC- AUC cruve to decide the threshold value
Shivam
how skewness and kurtosis are used in statistics
Owen Reply
yes what is it
Taneeya
Got questions? Join the online conversation and get instant answers!
Jobilize.com Reply

Get Jobilize Job Search Mobile App in your pocket Now!

Get it on Google Play Download on the App Store Now


Source:  OpenStax, Biology. OpenStax CNX. Feb 29, 2016 Download for free at http://cnx.org/content/col11448/1.10
Google Play and the Google Play logo are trademarks of Google Inc.

Notification Switch

Would you like to follow the 'Biology' conversation and receive update notifications?

Ask