<< Chapter < Page Chapter >> Page >
By the end of this section, you will be able to:
  • Describe how oxygen is bound to hemoglobin and transported to body tissues
  • Explain how carbon dioxide is transported from body tissues to the lungs

Once the oxygen diffuses across the alveoli, it enters the bloodstream and is transported to the tissues where it is unloaded, and carbon dioxide diffuses out of the blood and into the alveoli to be expelled from the body. Although gas exchange is a continuous process, the oxygen and carbon dioxide are transported by different mechanisms.

Transport of oxygen in the blood

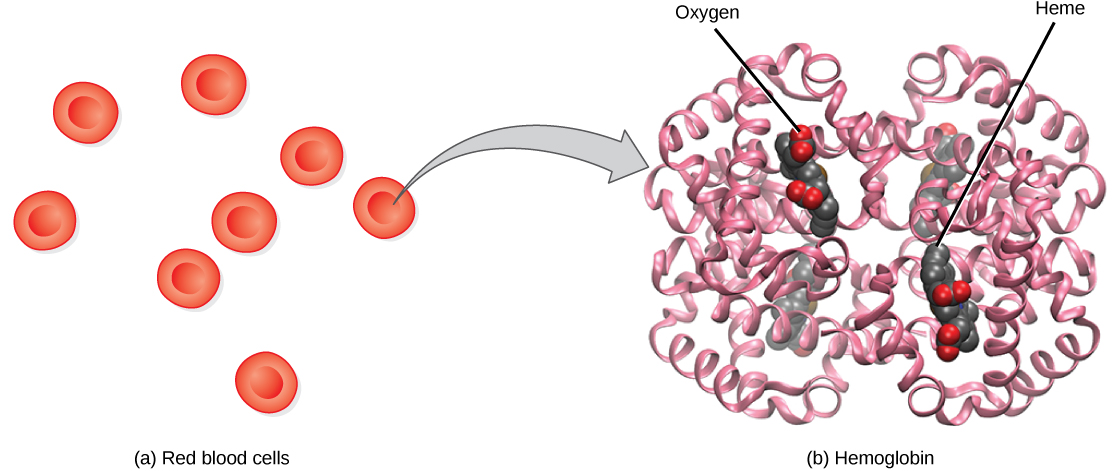
Although oxygen dissolves in blood, only a small amount of oxygen is transported this way. Only 1.5 percent of oxygen in the blood is dissolved directly into the blood itself. Most oxygen—98.5 percent—is bound to a protein called hemoglobin and carried to the tissues.

Hemoglobin

Hemoglobin , or Hb, is a protein molecule found in red blood cells (erythrocytes) made of four subunits: two alpha subunits and two beta subunits ( [link] ). Each subunit surrounds a central heme group    that contains iron and binds one oxygen molecule, allowing each hemoglobin molecule to bind four oxygen molecules. Molecules with more oxygen bound to the heme groups are brighter red. As a result, oxygenated arterial blood where the Hb is carrying four oxygen molecules is bright red, while venous blood that is deoxygenated is darker red.

Part a shows disc-shaped red blood cells. An arrow points from a red blood cell to the hemoglobin in part b. Hemoglobin is made up of coiled helices. The left, right, bottom, and top parts of the molecule are symmetrical. Four small heme groups are associated with hemoglobin. Oxygen is bound to the heme.
The protein inside (a) red blood cells that carries oxygen to cells and carbon dioxide to the lungs is (b) hemoglobin. Hemoglobin is made up of four symmetrical subunits and four heme groups. Iron associated with the heme binds oxygen. It is the iron in hemoglobin that gives blood its red color.

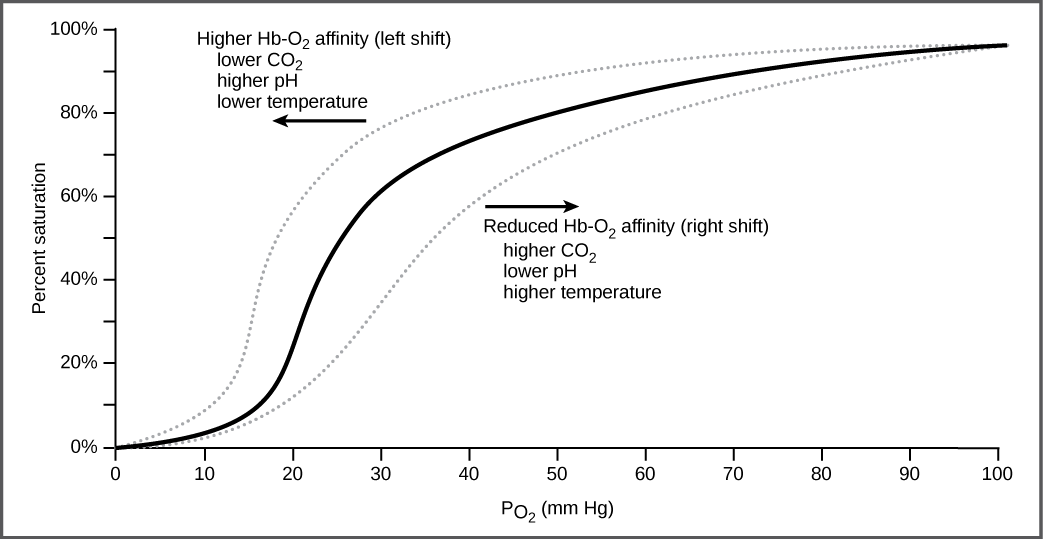
It is easier to bind a second and third oxygen molecule to Hb than the first molecule. This is because the hemoglobin molecule changes its shape, or conformation, as oxygen binds. The fourth oxygen is then more difficult to bind. The binding of oxygen to hemoglobin can be plotted as a function of the partial pressure of oxygen in the blood (x-axis) versus the relative Hb-oxygen saturation (y-axis). The resulting graph—an oxygen dissociation curve    —is sigmoidal, or S-shaped ( [link] ). As the partial pressure of oxygen increases, the hemoglobin becomes increasingly saturated with oxygen.

Art connection

The graph plots percent oxygen saturation of hemoglobin as a function of oxygen partial pressure. Oxygen saturation increases in an S-shaped curve, from 0 to 100 percent. The curve shifts to the left under conditions of low carbon dioxide, high pH, and low temperature, and to the right in conditions of high carbon dioxide, low pH, or high temperature.
The oxygen dissociation curve demonstrates that, as the partial pressure of oxygen increases, more oxygen binds hemoglobin. However, the affinity of hemoglobin for oxygen may shift to the left or the right depending on environmental conditions.

The kidneys are responsible for removing excess H+ ions from the blood. If the kidneys fail, what would happen to blood pH and to hemoglobin affinity for oxygen?

Factors that affect oxygen binding

The oxygen-carrying capacity    of hemoglobin determines how much oxygen is carried in the blood. In addition to P O 2 , other environmental factors and diseases can affect oxygen carrying capacity and delivery.

Carbon dioxide levels, blood pH, and body temperature affect oxygen-carrying capacity ( [link] ). When carbon dioxide is in the blood, it reacts with water to form bicarbonate (HCO 3 ) and hydrogen ions (H + ). As the level of carbon dioxide in the blood increases, more H + is produced and the pH decreases. This increase in carbon dioxide and subsequent decrease in pH reduce the affinity of hemoglobin for oxygen. The oxygen dissociates from the Hb molecule, shifting the oxygen dissociation curve to the right. Therefore, more oxygen is needed to reach the same hemoglobin saturation level as when the pH was higher. A similar shift in the curve also results from an increase in body temperature. Increased temperature, such as from increased activity of skeletal muscle, causes the affinity of hemoglobin for oxygen to be reduced.

Questions & Answers

differentiate between demand and supply giving examples
Lambiv Reply
differentiated between demand and supply using examples
Lambiv
what is labour ?
Lambiv
how will I do?
Venny Reply
how is the graph works?I don't fully understand
Rezat Reply
information
Eliyee
devaluation
Eliyee
t
WARKISA
hi guys good evening to all
Lambiv
multiple choice question
Aster Reply
appreciation
Eliyee
explain perfect market
Lindiwe Reply
In economics, a perfect market refers to a theoretical construct where all participants have perfect information, goods are homogenous, there are no barriers to entry or exit, and prices are determined solely by supply and demand. It's an idealized model used for analysis,
Ezea
What is ceteris paribus?
Shukri Reply
other things being equal
AI-Robot
When MP₁ becomes negative, TP start to decline. Extuples Suppose that the short-run production function of certain cut-flower firm is given by: Q=4KL-0.6K2 - 0.112 • Where is quantity of cut flower produced, I is labour input and K is fixed capital input (K-5). Determine the average product of lab
Kelo
Extuples Suppose that the short-run production function of certain cut-flower firm is given by: Q=4KL-0.6K2 - 0.112 • Where is quantity of cut flower produced, I is labour input and K is fixed capital input (K-5). Determine the average product of labour (APL) and marginal product of labour (MPL)
Kelo
yes,thank you
Shukri
Can I ask you other question?
Shukri
what is monopoly mean?
Habtamu Reply
What is different between quantity demand and demand?
Shukri Reply
Quantity demanded refers to the specific amount of a good or service that consumers are willing and able to purchase at a give price and within a specific time period. Demand, on the other hand, is a broader concept that encompasses the entire relationship between price and quantity demanded
Ezea
ok
Shukri
how do you save a country economic situation when it's falling apart
Lilia Reply
what is the difference between economic growth and development
Fiker Reply
Economic growth as an increase in the production and consumption of goods and services within an economy.but Economic development as a broader concept that encompasses not only economic growth but also social & human well being.
Shukri
production function means
Jabir
What do you think is more important to focus on when considering inequality ?
Abdisa Reply
any question about economics?
Awais Reply
sir...I just want to ask one question... Define the term contract curve? if you are free please help me to find this answer 🙏
Asui
it is a curve that we get after connecting the pareto optimal combinations of two consumers after their mutually beneficial trade offs
Awais
thank you so much 👍 sir
Asui
In economics, the contract curve refers to the set of points in an Edgeworth box diagram where both parties involved in a trade cannot be made better off without making one of them worse off. It represents the Pareto efficient allocations of goods between two individuals or entities, where neither p
Cornelius
In economics, the contract curve refers to the set of points in an Edgeworth box diagram where both parties involved in a trade cannot be made better off without making one of them worse off. It represents the Pareto efficient allocations of goods between two individuals or entities,
Cornelius
Suppose a consumer consuming two commodities X and Y has The following utility function u=X0.4 Y0.6. If the price of the X and Y are 2 and 3 respectively and income Constraint is birr 50. A,Calculate quantities of x and y which maximize utility. B,Calculate value of Lagrange multiplier. C,Calculate quantities of X and Y consumed with a given price. D,alculate optimum level of output .
Feyisa Reply
Answer
Feyisa
c
Jabir
the market for lemon has 10 potential consumers, each having an individual demand curve p=101-10Qi, where p is price in dollar's per cup and Qi is the number of cups demanded per week by the i th consumer.Find the market demand curve using algebra. Draw an individual demand curve and the market dema
Gsbwnw Reply
suppose the production function is given by ( L, K)=L¼K¾.assuming capital is fixed find APL and MPL. consider the following short run production function:Q=6L²-0.4L³ a) find the value of L that maximizes output b)find the value of L that maximizes marginal product
Abdureman
types of unemployment
Yomi Reply
What is the difference between perfect competition and monopolistic competition?
Mohammed
Got questions? Join the online conversation and get instant answers!
Jobilize.com Reply

Get Jobilize Job Search Mobile App in your pocket Now!

Get it on Google Play Download on the App Store Now


Source:  OpenStax, Biology. OpenStax CNX. Feb 29, 2016 Download for free at http://cnx.org/content/col11448/1.10
Google Play and the Google Play logo are trademarks of Google Inc.

Notification Switch

Would you like to follow the 'Biology' conversation and receive update notifications?

Ask