<< Chapter < Page Chapter >> Page >
By the end of this section, you will be able to:
  • Discuss the need for a comprehensive classification system
  • List the different levels of the taxonomic classification system
  • Describe how systematics and taxonomy relate to phylogeny
  • Discuss the components and purpose of a phylogenetic tree

In scientific terms, the evolutionary history and relationship of an organism or group of organisms is called its phylogeny    . A phylogeny describes the relationships of an organism, such as from which organisms it is thought to have evolved, to which species it is most closely related, and so forth. Phylogenetic relationships provide information on shared ancestry but not necessarily on how organisms are similar or different.

Phylogenetic trees

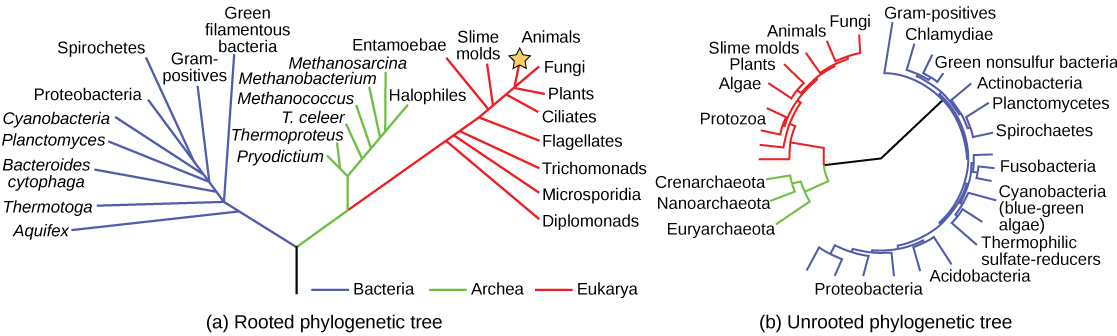
Scientists use a tool called a phylogenetic tree to show the evolutionary pathways and connections among organisms. A phylogenetic tree    is a diagram used to reflect evolutionary relationships among organisms or groups of organisms. Scientists consider phylogenetic trees to be a hypothesis of the evolutionary past since one cannot go back to confirm the proposed relationships. In other words, a “tree of life” can be constructed to illustrate when different organisms evolved and to show the relationships among different organisms ( [link] ).

Unlike a taxonomic classification diagram, a phylogenetic tree can be read like a map of evolutionary history. Many phylogenetic trees have a single lineage at the base representing a common ancestor. Scientists call such trees rooted    , which means there is a single ancestral lineage (typically drawn from the bottom or left) to which all organisms represented in the diagram relate. Notice in the rooted phylogenetic tree that the three domains— Bacteria, Archaea, and Eukarya—diverge from a single point and branch off. The small branch that plants and animals (including humans) occupy in this diagram shows how recent and miniscule these groups are compared with other organisms. Unrooted trees don’t show a common ancestor but do show relationships among species.

The phylogenetic tree in part a is rooted and resembles a living tree, with a common ancestor indicated as the base of the trunk. Two branches form from the trunk. The left branch leads to the domain Bacteria. The right branch branches again, giving rise to Archaea and Eukarya. Smaller branches within each domain indicate the groups present in that domain. The phylogenetic tree in part B is unrooted. It does not resemble a living tree; rather, groups of organisms within the Archaea, Eukarya, and Bacteria domains are arranged in a circle. Lines connect the groups within each domain. The groups within Archaea and Eukarya are then connected together. A line from the Archaea/ Eukarya domains, and another from the Bacteria meet in the center of the circle. There is no root, and therefore no indication of which domain arose first.
Both of these phylogenetic trees shows the relationship of the three domains of life—Bacteria, Archaea, and Eukarya—but the (a) rooted tree attempts to identify when various species diverged from a common ancestor while the (b) unrooted tree does not. (credit a: modification of work by Eric Gaba)

In a rooted tree, the branching indicates evolutionary relationships ( [link] ). The point where a split occurs, called a branch point    , represents where a single lineage evolved into a distinct new one. A lineage that evolved early from the root and remains unbranched is called basal taxon    . When two lineages stem from the same branch point, they are called sister taxa    . A branch with more than two lineages is called a polytomy    and serves to illustrate where scientists have not definitively determined all of the relationships. It is important to note that although sister taxa and polytomy do share an ancestor, it does not mean that the groups of organisms split or evolved from each other. Organisms in two taxa may have split apart at a specific branch point, but neither taxa gave rise to the other.

Questions & Answers

differentiate between demand and supply giving examples
Lambiv Reply
differentiated between demand and supply using examples
Lambiv
what is labour ?
Lambiv
how will I do?
Venny Reply
how is the graph works?I don't fully understand
Rezat Reply
information
Eliyee
devaluation
Eliyee
t
WARKISA
hi guys good evening to all
Lambiv
multiple choice question
Aster Reply
appreciation
Eliyee
explain perfect market
Lindiwe Reply
In economics, a perfect market refers to a theoretical construct where all participants have perfect information, goods are homogenous, there are no barriers to entry or exit, and prices are determined solely by supply and demand. It's an idealized model used for analysis,
Ezea
What is ceteris paribus?
Shukri Reply
other things being equal
AI-Robot
When MP₁ becomes negative, TP start to decline. Extuples Suppose that the short-run production function of certain cut-flower firm is given by: Q=4KL-0.6K2 - 0.112 • Where is quantity of cut flower produced, I is labour input and K is fixed capital input (K-5). Determine the average product of lab
Kelo
Extuples Suppose that the short-run production function of certain cut-flower firm is given by: Q=4KL-0.6K2 - 0.112 • Where is quantity of cut flower produced, I is labour input and K is fixed capital input (K-5). Determine the average product of labour (APL) and marginal product of labour (MPL)
Kelo
yes,thank you
Shukri
Can I ask you other question?
Shukri
what is monopoly mean?
Habtamu Reply
What is different between quantity demand and demand?
Shukri Reply
Quantity demanded refers to the specific amount of a good or service that consumers are willing and able to purchase at a give price and within a specific time period. Demand, on the other hand, is a broader concept that encompasses the entire relationship between price and quantity demanded
Ezea
ok
Shukri
how do you save a country economic situation when it's falling apart
Lilia Reply
what is the difference between economic growth and development
Fiker Reply
Economic growth as an increase in the production and consumption of goods and services within an economy.but Economic development as a broader concept that encompasses not only economic growth but also social & human well being.
Shukri
production function means
Jabir
What do you think is more important to focus on when considering inequality ?
Abdisa Reply
any question about economics?
Awais Reply
sir...I just want to ask one question... Define the term contract curve? if you are free please help me to find this answer 🙏
Asui
it is a curve that we get after connecting the pareto optimal combinations of two consumers after their mutually beneficial trade offs
Awais
thank you so much 👍 sir
Asui
In economics, the contract curve refers to the set of points in an Edgeworth box diagram where both parties involved in a trade cannot be made better off without making one of them worse off. It represents the Pareto efficient allocations of goods between two individuals or entities, where neither p
Cornelius
In economics, the contract curve refers to the set of points in an Edgeworth box diagram where both parties involved in a trade cannot be made better off without making one of them worse off. It represents the Pareto efficient allocations of goods between two individuals or entities,
Cornelius
Suppose a consumer consuming two commodities X and Y has The following utility function u=X0.4 Y0.6. If the price of the X and Y are 2 and 3 respectively and income Constraint is birr 50. A,Calculate quantities of x and y which maximize utility. B,Calculate value of Lagrange multiplier. C,Calculate quantities of X and Y consumed with a given price. D,alculate optimum level of output .
Feyisa Reply
Answer
Feyisa
c
Jabir
the market for lemon has 10 potential consumers, each having an individual demand curve p=101-10Qi, where p is price in dollar's per cup and Qi is the number of cups demanded per week by the i th consumer.Find the market demand curve using algebra. Draw an individual demand curve and the market dema
Gsbwnw Reply
suppose the production function is given by ( L, K)=L¼K¾.assuming capital is fixed find APL and MPL. consider the following short run production function:Q=6L²-0.4L³ a) find the value of L that maximizes output b)find the value of L that maximizes marginal product
Abdureman
types of unemployment
Yomi Reply
What is the difference between perfect competition and monopolistic competition?
Mohammed
Got questions? Join the online conversation and get instant answers!
Jobilize.com Reply

Get Jobilize Job Search Mobile App in your pocket Now!

Get it on Google Play Download on the App Store Now


Source:  OpenStax, Biology. OpenStax CNX. Feb 29, 2016 Download for free at http://cnx.org/content/col11448/1.10
Google Play and the Google Play logo are trademarks of Google Inc.

Notification Switch

Would you like to follow the 'Biology' conversation and receive update notifications?

Ask